Energizer 2012 Annual Report Download - page 97
Download and view the complete annual report
Please find page 97 of the 2012 Energizer annual report below. You can navigate through the pages in the report by either clicking on the pages listed below, or by using the keyword search tool below to find specific information within the annual report.-
 1
1 -
2
-
3
-
4
-
5
-
6
-
7
-
8
-
9
-
10
-
11
-
12
-
13
-
14
-
15
-
16
-
17
-
18
-
19
-
20
-
21
-
22
-
23
-
24
-
25
-
26
-
27
-
28
-
29
-
30
-
31
-
32
-
33
-
34
-
35
-
36
-
37
-
38
-
39
-
40
-
41
-
42
-
43
-
44
-
45
-
46
-
47
-
48
-
49
-
50
-
51
-
52
-
53
-
54
-
55
-
56
-
57
-
58
-
59
-
60
-
61
-
62
-
63
-
64
-
65
-
66
-
67
-
68
-
69
-
70
-
71
-
72
-
73
-
74
-
75
-
76
-
77
-
78
-
79
-
80
-
81
-
82
-
83
-
84
-
85
-
86
-
 87
87 -
 88
88 -
 89
89 -
 90
90 -
 91
91 -
 92
92 -
 93
93 -
 94
94 -
 95
95 -
 96
96 -
 97
97 -
 98
98 -
 99
99 -
 100
100 -
 101
101 -
 102
102 -
 103
103 -
 104
104 -
 105
105 -
 106
106 -
 107
107 -
108
-
109
-
110
-
111
-
112
-
113
-
114
-
115
-
116
-
117
-
118
-
119
-
120
-
121
-
122
-
123
-
124
 |
 |

ENERGIZER HOLDINGS, INC.
NOTES TO CONSOLIDATED FINANCIAL STATEMENTS
(Dollars in millions, except per share and percentage data)
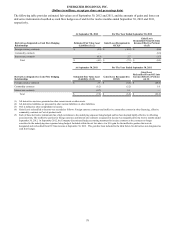
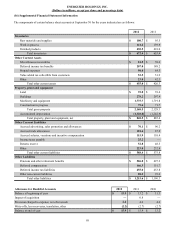
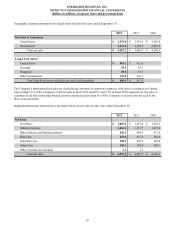
Geographic segment information on a legal entity basis for the years ended September 30:
2012 2011 2010
Net Sales to Customers
United States $ 2,355.0 $ 2,341.9 $ 2,196.8
International 2,212.2 2,303.8 2,051.5
Total net sales $ 4,567.2 $ 4,645.7 $ 4,248.3
Long-Lived Assets
United States $ 581.1 $ 615.6
Germany 81.5 93.3
Singapore 89.8 81.7
Other International 133.0 126.7
Total long-lived assets excluding goodwill and intangibles $ 885.4 $ 917.3
The Company’s international net sales are derived from customers in numerous countries, with sales to customers in Canada
representing 5.3% of the Company's total net sales in fiscal 2012 and 2011 and 5.7% in fiscal 2010, respectively. Net sales to
customers in all other individual foreign countries represented less than 5% of the Company’s total net sales for each of the
three years presented.
Supplemental product information is presented below for net sales for the years ended September 30:
2012 2011 2010
Net Sales
Wet Shave $ 1,687.6 $ 1,637.4 $ 1,265.1
Alkaline batteries 1,263.4 1,311.7 1,327.9
Other batteries and lighting products 824.3 884.3 871.8
Skin Care 423.0 417.6 383.0
Feminine Care 185.5 195.1 198.8
Infant Care 180.3 198.0 201.7
Other personal care products 3.1 1.6 —
Total net sales $ 4,567.2 $ 4,645.7 $ 4,248.3
87