Energizer 2012 Annual Report Download - page 49
Download and view the complete annual report
Please find page 49 of the 2012 Energizer annual report below. You can navigate through the pages in the report by either clicking on the pages listed below, or by using the keyword search tool below to find specific information within the annual report.-
 1
1 -
2
-
3
-
4
-
5
-
6
-
7
-
8
-
9
-
10
-
11
-
12
-
13
-
14
-
15
-
16
-
17
-
18
-
19
-
20
-
21
-
22
-
23
-
24
-
25
-
26
-
27
-
28
-
29
-
30
-
31
-
32
-
33
-
34
-
35
-
36
-
37
-
38
-
 39
39 -
 40
40 -
 41
41 -
 42
42 -
 43
43 -
 44
44 -
 45
45 -
 46
46 -
 47
47 -
 48
48 -
 49
49 -
 50
50 -
 51
51 -
 52
52 -
 53
53 -
 54
54 -
 55
55 -
 56
56 -
 57
57 -
 58
58 -
 59
59 -
60
-
61
-
62
-
63
-
64
-
65
-
66
-
67
-
68
-
69
-
70
-
71
-
72
-
73
-
74
-
75
-
76
-
77
-
78
-
79
-
80
-
81
-
82
-
83
-
84
-
85
-
86
-
87
-
88
-
89
-
90
-
91
-
92
-
93
-
94
-
95
-
96
-
97
-
98
-
99
-
100
-
101
-
102
-
103
-
104
-
105
-
106
-
107
-
108
-
109
-
110
-
111
-
112
-
113
-
114
-
115
-
116
-
117
-
118
-
119
-
120
-
121
-
122
-
123
-
124
 |
 |

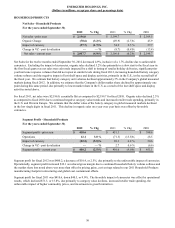
ENERGIZER HOLDINGS, INC.
(Dollars in millions, except per share and percentage data)
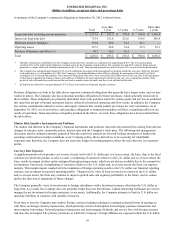
HOUSEHOLD PRODUCTS
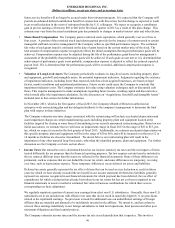
Net Sales - Household Products
For the years ended September 30,
2012 % Chg 2011 % Chg 2010
Net sales - prior year $ 2,196.0 $ 2,199.7 $ 2,109.5
Organic Change (70.6) (3.2)% (49.9) (2.3)% 45.9
Impact of currency (37.7) (1.7)% 54.9 2.5 % 57.7
Change in VZ - post devaluation ——% (8.7) (0.4)% (13.4)
Net sales - current year $ 2,087.7 (4.9)% $ 2,196.0 (0.2)% $ 2,199.7
Net Sales for the twelve months ended September 30, 2012 decreased 4.9%, inclusive of a 1.7% decline due to unfavorable
currencies. Excluding the impact of currencies, organic sales declined 3.2% due primarily to a slow start to the fiscal year in
the first fiscal quarter as net sales were adversely impacted by a shift in timing of retailer holiday deliveries, significant prior
year hurricane response volumes that did not repeat at similar levels during fiscal 2012, increasing household battery category
volume softness and the negative impact of lost shelf space and display activities, primarily in the U.S., in the second half of
the fiscal year. We estimate that battery category unit volumes declined approximately 5% in the Company's global measured
markets during fiscal 2012. In addition, we estimate that the Company's dollar market share declined by approximately one
point during this same period, due primarily to lower market share in the U.S. as a result of the lost shelf space and display
activities noted above.
For fiscal 2011, net sales were $2,196.0, essentially flat as compared to $2,199.7 for fiscal 2010. Organic sales declined 2.3%
as compared to fiscal 2010 due to continued negative category value trends and increased retailer trade spending, primarily in
the U.S. and Western Europe. We estimate that the dollar value of the battery category in global measured markets declined
in the low single digits in fiscal 2011. This decline in organic sales on a year over year basis was offset by favorable
currencies.
Segment Profit - Household Products
For the years ended September 30,
2012 % Chg 2011 % Chg 2010
Segment profit - prior year $ 410.6 $ 451.1 $ 398.6
Operations 12.1 3.0 % (71.3) (15.8)% 28.5
Impact of currency (22.5) (5.5)% 28.1 6.2 % 30.6
Change in VZ - post devaluation ——% 2.7 0.6 % (6.6)
Segment profit - current year $ 400.2 (2.5)% $ 410.6 (9.0)% $ 451.1
Segment profit for fiscal 2012 was $400.2, a decrease of $10.4, or 2.5%, due primarily to the unfavorable impact of currencies.
Operationally, segment profit increased $12.1 as reduced gross margin due to continued household battery volume softness and
the market share loss noted above was more than offset by pricing gains, cost savings related to our 2011 Household Products
manufacturing footprint restructuring and global cost containment efforts.
Segment profit for fiscal 2011 was $410.6, down $40.5, or 9.0%. The favorable impact of currencies was offset by operational
results, which declined $71.3, or 15.8%, due primarily to category value declines, increased retailer trade spending, the
unfavorable impact of higher commodity prices, and investments in growth initiatives.
39