Energizer 2012 Annual Report Download - page 90
Download and view the complete annual report
Please find page 90 of the 2012 Energizer annual report below. You can navigate through the pages in the report by either clicking on the pages listed below, or by using the keyword search tool below to find specific information within the annual report.-
 1
1 -
2
-
3
-
4
-
5
-
6
-
7
-
8
-
9
-
10
-
11
-
12
-
13
-
14
-
15
-
16
-
17
-
18
-
19
-
20
-
21
-
22
-
23
-
24
-
25
-
26
-
27
-
28
-
29
-
30
-
31
-
32
-
33
-
34
-
35
-
36
-
37
-
38
-
39
-
40
-
41
-
42
-
43
-
44
-
45
-
46
-
47
-
48
-
49
-
50
-
51
-
52
-
53
-
54
-
55
-
56
-
57
-
58
-
59
-
60
-
61
-
62
-
63
-
64
-
65
-
66
-
67
-
68
-
69
-
70
-
71
-
72
-
73
-
74
-
75
-
76
-
77
-
78
-
79
-
 80
80 -
 81
81 -
 82
82 -
 83
83 -
 84
84 -
 85
85 -
 86
86 -
 87
87 -
 88
88 -
 89
89 -
 90
90 -
 91
91 -
 92
92 -
 93
93 -
 94
94 -
 95
95 -
 96
96 -
 97
97 -
 98
98 -
 99
99 -
 100
100 -
101
-
102
-
103
-
104
-
105
-
106
-
107
-
108
-
109
-
110
-
111
-
112
-
113
-
114
-
115
-
116
-
117
-
118
-
119
-
120
-
121
-
122
-
123
-
124
 |
 |

ENERGIZER HOLDINGS, INC.
(Dollars in millions, except per share and percentage data)
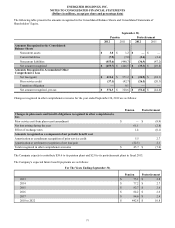
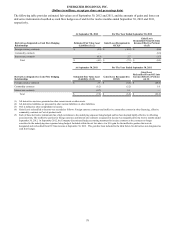
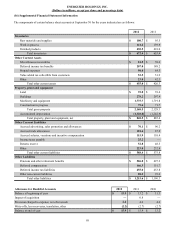
The following table provides estimated fair values as of September 30, 2012 and 2011, and the amounts of gains and losses on
derivative instruments not classified as cash flow hedges as of and for the twelve months ended September 30, 2012 and 2011,
respectively.
At September 30, 2012
For The Year Ended
September 30, 2012
Derivatives not designated as Cash Flow Hedging Relationships
Estimated Fair Value Asset
(Liability)
Gain/(Loss) Recognized in
Income (1)
Share option $ 2.5 $ 6.1
Commodity contracts (2) 1.6 1.6
Foreign currency contracts (0.7) (1.9)
Total $ 3.4 $ 5.8
At September 30, 2011
For The Year Ended
September 30, 2011
Derivatives not designated as Cash Flow Hedging Relationships
Estimated Fair Value Asset
(Liability)
Gain/(Loss) Recognized in
Income (1)
Share option $ (3.4) $ (0.6)
Foreign currency contracts 0.4 4.5
Total $ (3.0) $ 3.9
(1) Gain/(Loss) recognized in Income was recorded as follows: Share option in Selling, general and administrative expense and foreign currency and
commodity contracts in other financing.
(2) In September 2012, the Company discontinued hedge accounting treatment for its existing zinc contracts. These contracts no longer meet the accounting
requirements for classification as cash flow hedges because of an ineffective correlation to the underlying zinc exposure being hedged. Included in the table
above is a gain of $1.6 for the ineffective portion that was de-designated and reclassified from OCI into income at September 30, 2012.
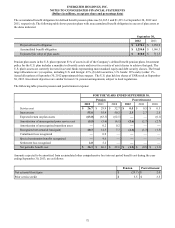
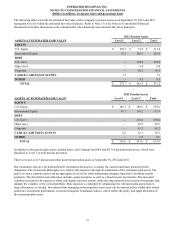
Fair Value Hierarchy Accounting guidance on fair value measurements for certain financial assets and liabilities requires that
assets and liabilities carried at fair value be classified in one of the following three categories:
Level 1: Quoted market prices in active markets for identical assets or liabilities.
Level 2: Observable market based inputs or unobservable inputs that are corroborated by market data.
Level 3: Unobservable inputs reflecting the reporting entity’s own assumptions or external inputs from inactive markets.
Under the fair value accounting guidance hierarchy, an entity is required to maximize the use of quoted market prices and
minimize the use of unobservable inputs. The following table sets forth the Company’s financial assets and liabilities, which are
carried at fair value, as of September 30, 2012 and 2011 that are measured on a recurring basis during the period, segregated by
level within the fair value hierarchy:
Level 2
September 30,
2012 2011
Assets/(Liabilities) at estimated fair value:
Deferred Compensation $ (161.6) $ (147.6)
Derivatives - Foreign Exchange (6.6) 3.7
Derivatives - Commodity 1.6 (6.2)
Derivatives - Interest Rate Swap (0.3) (4.7)
Share Option 2.5 (3.4)
Total Liabilities at estimated fair value $ (164.4) $ (158.2)
At September 30, 2012 and 2011 the Company had no level 1 or level 3 financial assets or liabilities.
See Note 7 of the Notes to Consolidated Financial Statements for further discussion of deferred compensation liabilities.
80