Energizer 2012 Annual Report Download - page 103
Download and view the complete annual report
Please find page 103 of the 2012 Energizer annual report below. You can navigate through the pages in the report by either clicking on the pages listed below, or by using the keyword search tool below to find specific information within the annual report.-
 1
1 -
2
-
3
-
4
-
5
-
6
-
7
-
8
-
9
-
10
-
11
-
12
-
13
-
14
-
15
-
16
-
17
-
18
-
19
-
20
-
21
-
22
-
23
-
24
-
25
-
26
-
27
-
28
-
29
-
30
-
31
-
32
-
33
-
34
-
35
-
36
-
37
-
38
-
39
-
40
-
41
-
42
-
43
-
44
-
45
-
46
-
47
-
48
-
49
-
50
-
51
-
52
-
53
-
54
-
55
-
56
-
57
-
58
-
59
-
60
-
61
-
62
-
63
-
64
-
65
-
66
-
67
-
68
-
69
-
70
-
71
-
72
-
73
-
74
-
75
-
76
-
77
-
78
-
79
-
80
-
81
-
82
-
83
-
84
-
85
-
86
-
87
-
88
-
89
-
90
-
91
-
92
-
 93
93 -
 94
94 -
 95
95 -
 96
96 -
 97
97 -
 98
98 -
 99
99 -
 100
100 -
 101
101 -
 102
102 -
 103
103 -
 104
104 -
 105
105 -
 106
106 -
 107
107 -
 108
108 -
 109
109 -
 110
110 -
 111
111 -
 112
112 -
 113
113 -
114
-
115
-
116
-
117
-
118
-
119
-
120
-
121
-
122
-
123
-
124
 |
 |

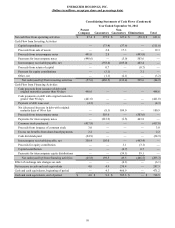
ENERGIZER HOLDINGS, INC.
(Dollars in millions, except per share and percentage data)
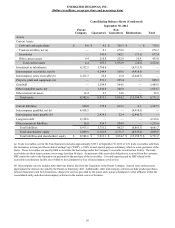
Consolidating Statements of Cash Flows (Condensed)
Year Ended September 30, 2012
Parent
Company Guarantors
Non-
Guarantors Eliminations Total
Net cash flow from operating activities $ 87.4 $ 275.9 $ 327.4 $ (59.1) $ 631.6
Cash Flow from Investing Activities
Capital expenditures — (73.4)(37.6)—
(111.0)
Proceeds from sale of assets — 2.0 17.3 — 19.3
Proceeds from intercompany notes 441.0 2.8 — (443.8)—
Payments for intercompany notes (498.6)—
(5.0) 503.6 —
Intercompany receivable/payable, net — (358.4)(105.0) 463.4 —
Proceeds from return of capital — 0.7 — (0.7)—
Payment for equity contributions — (3.1) — 3.1 —
Other, net — (1.1)(2.1)—
(3.2)
Net cash (used by)/from investing activities (57.6)(430.5)(132.4) 525.6 (94.9)
Cash Flow from Financing Activities
Cash proceeds from issuance of debt with
original maturities greater than 90 days 498.6 — — — 498.6
Cash payments on debt with original maturities
greater than 90 days (441.0)— — —
(441.0)
Payment of debt issue cost (4.3)— — —
(4.3)
Net (decrease)/increase in debt with original
maturity days of 90 or less — (8.1) 109.0 — 100.9
Proceeds from intercompany notes — 503.6 — (503.6)—
Payments for intercompany notes — (441.0)(2.8) 443.8 —
Common stock purchased (417.8)— — —
(417.8)
Proceeds from issuance of common stock 3.0 — — — 3.0
Excess tax benefits from share-based payments 2.2 — — — 2.2
Cash dividends paid (24.9)— — —
(24.9)
Intercompany receivable/payable, net 358.4 105.0 — (463.4)—
Proceeds for equity contribution — — 3.1 (3.1)—
Capital contribution — — (0.7) 0.7 —
Payments for intercompany equity distributions — — (59.1) 59.1 —
Net cash (used by)/from financing activities (25.8) 159.5 49.5 (466.5)(283.3)
Effect of exchange rate changes on cash — — (6.1)—
(6.1)
Net increase in cash and cash equivalents 4.0 4.9 238.4 — 247.3
Cash and cash equivalents, beginning of period — 4.3 466.9 — 471.2
Cash and cash equivalents, end of period $ 4.0 $ 9.2 $ 705.3 $ — $ 718.5
93