Energizer 2012 Annual Report Download - page 44
Download and view the complete annual report
Please find page 44 of the 2012 Energizer annual report below. You can navigate through the pages in the report by either clicking on the pages listed below, or by using the keyword search tool below to find specific information within the annual report.-
 1
1 -
2
-
3
-
4
-
5
-
6
-
7
-
8
-
9
-
10
-
11
-
12
-
13
-
14
-
15
-
16
-
17
-
18
-
19
-
20
-
21
-
22
-
23
-
24
-
25
-
26
-
27
-
28
-
29
-
30
-
31
-
32
-
33
-
 34
34 -
 35
35 -
 36
36 -
 37
37 -
 38
38 -
 39
39 -
 40
40 -
 41
41 -
 42
42 -
 43
43 -
 44
44 -
 45
45 -
 46
46 -
 47
47 -
 48
48 -
 49
49 -
 50
50 -
 51
51 -
 52
52 -
 53
53 -
 54
54 -
55
-
56
-
57
-
58
-
59
-
60
-
61
-
62
-
63
-
64
-
65
-
66
-
67
-
68
-
69
-
70
-
71
-
72
-
73
-
74
-
75
-
76
-
77
-
78
-
79
-
80
-
81
-
82
-
83
-
84
-
85
-
86
-
87
-
88
-
89
-
90
-
91
-
92
-
93
-
94
-
95
-
96
-
97
-
98
-
99
-
100
-
101
-
102
-
103
-
104
-
105
-
106
-
107
-
108
-
109
-
110
-
111
-
112
-
113
-
114
-
115
-
116
-
117
-
118
-
119
-
120
-
121
-
122
-
123
-
124
 |
 |

ENERGIZER HOLDINGS, INC.
(Dollars in millions, except per share and percentage data)
margin and overheads as a percent of sales. In addition, approximately a quarter of the gross savings will be used to increase
investment in brand building and innovation to drive future growth, and enable investments in information technology systems
to improve capabilities and reduce costs.
Financial Results
For the year ended September 30, 2012, net earnings were $408.9, or $6.22 per diluted share, compared to net earnings of
$261.2 or $3.72 per diluted share, in fiscal 2011 and $403.0, or $5.72 per diluted share, in fiscal 2010. Total average diluted
shares outstanding were 65.7 million, 70.3 million and 70.5 million for fiscal 2012, 2011 and 2010, respectively. The decline in
average diluted shares outstanding over the time period presented was the result of share repurchase activity.
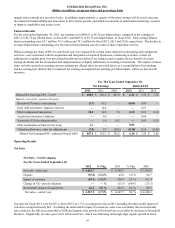
Diluted earnings per share (EPS) for each fiscal year were impacted by certain items related to restructuring and realignment
activities, costs associated with the acquisition and integration of acquired businesses, refinancing activities, certain tax
adjustments to update prior year provisions/benefits and net deferred tax balances and recognize the tax benefit of certain
foreign dividends and the devaluation and implementation of highly inflationary accounting in Venezuela. The impacts of these
items on both reported net earnings and net earnings per diluted share are provided below as a reconciliation of net earnings
and net earnings per diluted share to adjusted net earnings and adjusted net earnings per diluted share, which are non-GAAP
measures.
For The Years Ended September 30,
Net Earnings Diluted EPS
2012 2011 2010 2012 2011 2010
Diluted Net Earnings/EPS - GAAP $ 408.9 $ 261.2 $ 403.0 $ 6.22 $ 3.72 $ 5.72
Impacts, net of tax: expense (income)
Household Products restructuring (5.7)63.3 — (0.09)0.89 —
Early debt retirement / duplicate interest —14.4 — —0.21 —
Other realignment/integration 10.2 10.5 7.6 0.15 0.15 0.10
Acquisition inventory valuation —4.4 — —0.06 —
Venezuela (VZ) devaluation/other —1.8 14.2 —0.03 0.20
Early termination of interest rate swap 1.1 ——
0.02 ——
Valuation allowance, other tax adjustments (7.0)9.7 (29.6)(0.10)0.14 (0.42)
Diluted Net Earnings/EPS - adjusted (Non-GAAP) $ 407.5 $ 365.3 $ 395.2 $ 6.20 $ 5.20 $ 5.60
Operating Results
Net Sales
Net Sales - Total Company
For the Years Ended September 30,
2012 % Chg 2011 % Chg 2010
Net sales - prior year $ 4,645.7 $ 4,248.3 $ 3,999.8
Organic (55.6) (1.2)% 42.0 1.0 % 80.7
Impact of currency (69.1) (1.5)% 108.4 2.6 % 101.4
Change in VZ - post devaluation ——% (15.3) (0.4)% (23.3)
Incremental impact of acquisitions 46.2 1.0 % 262.3 6.2 % 89.7
Net sales - current year $ 4,567.2 (1.7)% $ 4,645.7 9.4 % $ 4,248.3
Net sales for fiscal 2012 were $4,567.2, down $78.5 or 1.7%, as compared to fiscal 2011 including the unfavorable impact of
currencies of approximately $69. Excluding the unfavorable impact of currencies, sales were essentially flat as incremental
sales related to the full year ownership of ASR and organic sales growth in Personal Care were offset by declines in Household
Products. Organically, net sales grew 0.6% in Personal Care, which was following mid-single digit organic growth in fiscal
34