Energizer 2012 Annual Report Download - page 106
Download and view the complete annual report
Please find page 106 of the 2012 Energizer annual report below. You can navigate through the pages in the report by either clicking on the pages listed below, or by using the keyword search tool below to find specific information within the annual report.-
 1
1 -
2
-
3
-
4
-
5
-
6
-
7
-
8
-
9
-
10
-
11
-
12
-
13
-
14
-
15
-
16
-
17
-
18
-
19
-
20
-
21
-
22
-
23
-
24
-
25
-
26
-
27
-
28
-
29
-
30
-
31
-
32
-
33
-
34
-
35
-
36
-
37
-
38
-
39
-
40
-
41
-
42
-
43
-
44
-
45
-
46
-
47
-
48
-
49
-
50
-
51
-
52
-
53
-
54
-
55
-
56
-
57
-
58
-
59
-
60
-
61
-
62
-
63
-
64
-
65
-
66
-
67
-
68
-
69
-
70
-
71
-
72
-
73
-
74
-
75
-
76
-
77
-
78
-
79
-
80
-
81
-
82
-
83
-
84
-
85
-
86
-
87
-
88
-
89
-
90
-
91
-
92
-
93
-
94
-
95
-
 96
96 -
 97
97 -
 98
98 -
 99
99 -
 100
100 -
 101
101 -
 102
102 -
 103
103 -
 104
104 -
 105
105 -
 106
106 -
 107
107 -
 108
108 -
 109
109 -
 110
110 -
 111
111 -
 112
112 -
 113
113 -
 114
114 -
 115
115 -
 116
116 -
117
-
118
-
119
-
120
-
121
-
122
-
123
-
124
 |
 |

ENERGIZER HOLDINGS, INC.
(Dollars in millions, except per share and percentage data)
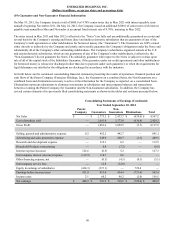
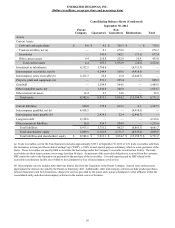
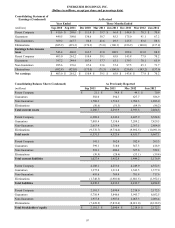
The Company revised its Condensed Consolidating Statements of Earnings to eliminate the incorrect inclusion of intercompany
dividends. These revisions resulted in a reduction of the Guarantors net earnings with a corresponding reduction to
Eliminations. The reported net earnings of the Parent and Non-Guarantors was not impacted by this error. The Company also
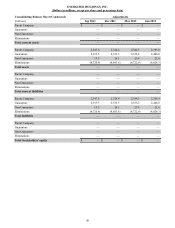
revised its Condensed Consolidating Balance Sheets to present intercompany notes between the Parent, Guarantor and the Non-
Guarantor subsidiaries on a gross basis, rather than showing intercompany obligations on a net basis. Additionally, the
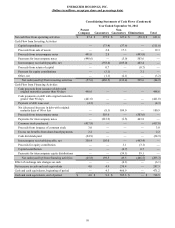
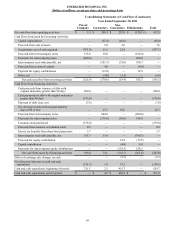
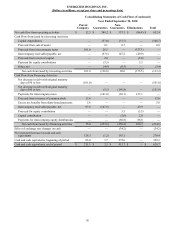
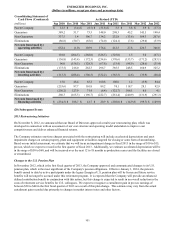
Company revised its Condensed Consolidating Statements of Cash Flows to correct the presentation of certain intercompany
activities between the Parent, Guarantor and Non-Guarantor subsidiaries for loans, capital contributions/returns, return on
equity and repayments. These revisions resulted in offsetting amounts to certain line items and did not impact total cash flow
for any of the subsidiaries presented. The Company assessed the materiality of these items on previously issued annual and
interim financial statements in accordance with SEC Staff Accounting Bulletin No. 99 and No. 108, and concluded that the
revisions were not material to the Condensed Consolidating Financial Statements for any period presented. The prior period
quarterly Condensed Consolidating Financial Statements will also be presented in our Form 10-Q filings in fiscal year 2013 as
revised consistent with the presentation below. There were no changes to the Company's Consolidated Financial Statements as
a result of these revisions. The impact of these revisions is shown in the following tables.
Consolidating Statement of
Earnings (Condensed) As Previously Reported
Year Ended Three Months Ended
(millions) Sep 2010 Sep 2011 Dec 2010 Mar 2011 Jun 2011 Dec 2011 Mar 2012 Jun 2012
Parent Company $ 410.6 $ 268.6 $ 111.4 $ 39.7 $ 66.4 $ 144.8 $ 78.3 $ 70.4
Guarantors 536.3 433.1 189.3 65.6 93.7 182.6 112.5 72.1
Non-Guarantors 369.2 247.7 86.8 41.6 49.3 125.5 83.6 88.6
Eliminations (772.7) (543.4) (225.0)(85.9)(108.5)(244.5)(161.4)(142.3)
Earnings before income
taxes 543.4 406.0 162.5 61.0 100.9 208.4 113.0 88.8
Parent Company 403.0 261.2 110.4 39.1 65.9 143.8 77.9 70.2
Guarantors 484.0 368.5 158.1 52.6 71.5 146.9 99.5 70.8
Non-Guarantors 285.6 176.6 67.6 33.6 37.4 97.5 65.1 71.7
Eliminations (769.6) (545.1) (225.7)(86.2)(108.9)(244.4)(164.6)(142.5)
Net earnings $ 403.0 $ 261.2 $ 110.4 $ 39.1 $ 65.9 $ 143.8 $ 77.9 $ 70.2
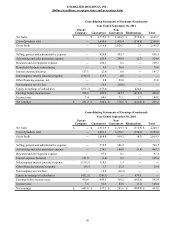
Consolidating Statement of
Earnings (Condensed) Adjustments
Year Ended Three Months Ended
(millions) Sep 2010 Sep 2011 Dec 2010 Mar 2011 Jun 2011 Dec 2011 Mar 2012 Jun 2012
Parent Company $ — $ — $ — $ — $ — $ — $ — $ —
Guarantors (86.8) (124.1) (50.7)(14.9)(8.4)(7.6)(21.4)(4.9)
Non-Guarantors — — — — — — — —
Eliminations 86.8 124.1 50.7 14.9 8.4 7.6 21.4 4.9
Earnings before income
taxes —— ———— ——
Parent Company — — — — — — — —
Guarantors (86.8) (124.1) (50.7)(14.9)(8.4)(7.6)(21.4)(4.9)
Non-Guarantors — — — — — — — —
Eliminations 86.8 124.1 50.7 14.9 8.4 7.6 21.4 4.9
Net earnings $—$—$ —$—$—$—$ —$—
96