Energizer 2012 Annual Report Download - page 89
Download and view the complete annual report
Please find page 89 of the 2012 Energizer annual report below. You can navigate through the pages in the report by either clicking on the pages listed below, or by using the keyword search tool below to find specific information within the annual report.-
 1
1 -
2
-
3
-
4
-
5
-
6
-
7
-
8
-
9
-
10
-
11
-
12
-
13
-
14
-
15
-
16
-
17
-
18
-
19
-
20
-
21
-
22
-
23
-
24
-
25
-
26
-
27
-
28
-
29
-
30
-
31
-
32
-
33
-
34
-
35
-
36
-
37
-
38
-
39
-
40
-
41
-
42
-
43
-
44
-
45
-
46
-
47
-
48
-
49
-
50
-
51
-
52
-
53
-
54
-
55
-
56
-
57
-
58
-
59
-
60
-
61
-
62
-
63
-
64
-
65
-
66
-
67
-
68
-
69
-
70
-
71
-
72
-
73
-
74
-
75
-
76
-
77
-
78
-
 79
79 -
 80
80 -
 81
81 -
 82
82 -
 83
83 -
 84
84 -
 85
85 -
 86
86 -
 87
87 -
 88
88 -
 89
89 -
 90
90 -
 91
91 -
 92
92 -
 93
93 -
 94
94 -
 95
95 -
 96
96 -
 97
97 -
 98
98 -
 99
99 -
100
-
101
-
102
-
103
-
104
-
105
-
106
-
107
-
108
-
109
-
110
-
111
-
112
-
113
-
114
-
115
-
116
-
117
-
118
-
119
-
120
-
121
-
122
-
123
-
124
 |
 |

ENERGIZER HOLDINGS, INC.
(Dollars in millions, except per share and percentage data)
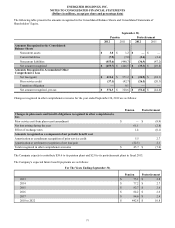
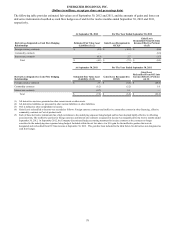
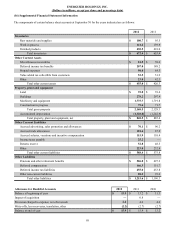
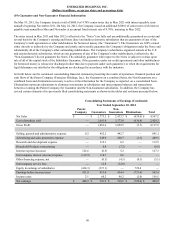
The following table provides estimated fair values as of September 30, 2012 and 2011, and the amounts of gains and losses on
derivative instruments classified as cash flow hedges as of and for the twelve months ended September 30, 2012 and 2011,
respectively.
At September 30, 2012 For The Year Ended September 30, 2012
Derivatives designated as Cash Flow Hedging
Relationships
Estimated Fair Value Asset
(Liability) (1) (2)
Gain/(Loss) Recognized in
OCI(3)
Gain/(Loss)
Reclassified From OCI into
Income (Effective Portion)
(4) (5)
Foreign currency contracts $ (5.9) $ (10.0) $ (0.8)
Commodity contracts — — (6.0)
Interest rate contracts (0.3) 2.7 (1.7)
Total $ (6.2) $ (7.3) $ (8.5)
At September 30, 2011 For The Year Ended September 30, 2011
Derivatives designated as Cash Flow Hedging
Relationships
Estimated Fair Value Asset
(Liability) (1) (2)
Gain/(Loss) Recognized in
OCI(3)
Gain/(Loss)
Reclassified From OCI into
Income (Effective Portion)
(4) (5)
Foreign currency contracts $ 3.3 $ (4.5) $ (24.6)
Commodity contracts (6.2) (5.2) 1.0
Interest rate contracts (4.7) 3.1 —
Total $ (7.6) $ (6.6) $ (23.6)
(1) All derivative assets are presented in other current assets or other assets.
(2) All derivative liabilities are presented in other current liabilities or other liabilities.
(3) OCI is defined as other comprehensive income.
(4) Gain/(Loss) reclassified to Income was recorded as follows: Foreign currency contracts and ineffective commodity contract in other financing, effective
commodity contracts in Cost of products sold.
(5) Each of these derivative instruments has a high correlation to the underlying exposure being hedged and has been deemed highly effective in offsetting
associated risk. The ineffective portion for foreign currency and interest rate contracts recognized in income was insignificant to the twelve months ended
September 30, 2012. In September 2012, the Company discontinued hedge accounting treatment for its zinc contracts as the contracts no longer
correlated to the underlying zinc exposure being hedged. Included within the net loss above is a $1.6 gain for the ineffective portion that was de-
designated and reclassified from OCI into income at September 30, 2012. This gain has been included in the table below for derivatives not designated as
cash flow hedges.
79