Energizer 2012 Annual Report Download - page 107
Download and view the complete annual report
Please find page 107 of the 2012 Energizer annual report below. You can navigate through the pages in the report by either clicking on the pages listed below, or by using the keyword search tool below to find specific information within the annual report.-
 1
1 -
2
-
3
-
4
-
5
-
6
-
7
-
8
-
9
-
10
-
11
-
12
-
13
-
14
-
15
-
16
-
17
-
18
-
19
-
20
-
21
-
22
-
23
-
24
-
25
-
26
-
27
-
28
-
29
-
30
-
31
-
32
-
33
-
34
-
35
-
36
-
37
-
38
-
39
-
40
-
41
-
42
-
43
-
44
-
45
-
46
-
47
-
48
-
49
-
50
-
51
-
52
-
53
-
54
-
55
-
56
-
57
-
58
-
59
-
60
-
61
-
62
-
63
-
64
-
65
-
66
-
67
-
68
-
69
-
70
-
71
-
72
-
73
-
74
-
75
-
76
-
77
-
78
-
79
-
80
-
81
-
82
-
83
-
84
-
85
-
86
-
87
-
88
-
89
-
90
-
91
-
92
-
93
-
94
-
95
-
96
-
 97
97 -
 98
98 -
 99
99 -
 100
100 -
 101
101 -
 102
102 -
 103
103 -
 104
104 -
 105
105 -
 106
106 -
 107
107 -
 108
108 -
 109
109 -
 110
110 -
 111
111 -
 112
112 -
 113
113 -
 114
114 -
 115
115 -
 116
116 -
 117
117 -
118
-
119
-
120
-
121
-
122
-
123
-
124
 |
 |
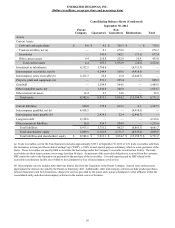
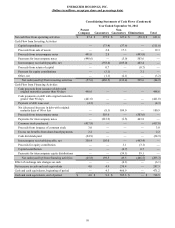
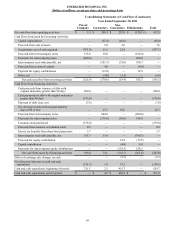
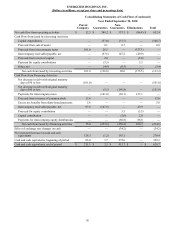
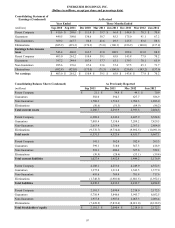
ENERGIZER HOLDINGS, INC.
(Dollars in millions, except per share and percentage data)
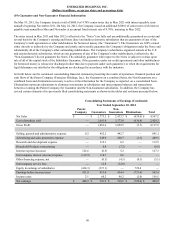
Consolidating Statement of
Earnings (Condensed) As Revised
Year Ended Three Months Ended
(millions) Sep 2010 Sep 2011 Dec 2010 Mar 2011 Jun 2011 Dec 2011 Mar 2012 Jun 2012
Parent Company $ 410.6 $ 268.6 $ 111.4 $ 39.7 $ 66.4 $ 144.8 $ 78.3 $ 70.4
Guarantors 449.5 309.0 138.6 50.7 85.3 175.0 91.1 67.2
Non-Guarantors 369.2 247.7 86.8 41.6 49.3 125.5 83.6 88.6
Eliminations (685.9) (419.3) (174.3)(71.0)(100.1)(236.9)(140.0)(137.4)
Earnings before income
taxes 543.4 406.0 162.5 61.0 100.9 208.4 113.0 88.8
Parent Company 403.0 261.2 110.4 39.1 65.9 143.8 77.9 70.2
Guarantors 397.2 244.4 107.4 37.7 63.1 139.3 78.1 65.9
Non-Guarantors 285.6 176.6 67.6 33.6 37.4 97.5 65.1 71.7
Eliminations (682.8) (421.0) (175.0)(71.3)(100.5)(236.8)(143.2)(137.6)
Net earnings $ 403.0 $ 261.2 $ 110.4 $ 39.1 $ 65.9 $ 143.8 $ 77.9 $ 70.2
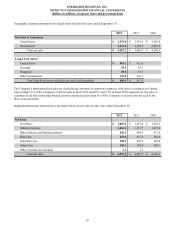
Consolidating Balance Sheet (Condensed) As Previously Reported
(millions) Sep 2011 Dec 2011 Mar 2012 Jun 2012
Parent Company $ 21.1 $ 34.8 $ 44.5 $ 70.9
Guarantors 582.0 594.3 627.7 586.9
Non-Guarantors 1,708.2 1,716.3 1,786.3 1,893.0
Eliminations (50.6)(51.5)(64.9)(86.2)
Total current assets 2,260.7 2,293.9 2,393.6 2,464.6
Parent Company 6,209.4 6,343.4 6,467.9 6,524.6
Guarantors 7,085.4 7,158.4 7,289.2 7,429.5
Non-Guarantors 2,613.4 2,756.4 2,767.1 2,804.0
Eliminations (9,376.7)(9,734.6)(9,892.5)(10,091.0)
Total assets 6,531.5 6,523.6 6,631.7 6,667.1
Parent Company 141.1 562.8 582.4 265.3
Guarantors 399.1 318.0 367.3 418.9
Non-Guarantors 518.1 600.4 527.6 552.1
Eliminations (30.9)(28.4)(33.1)(59.4)
Total current liabilities 1,027.4 1,452.8 1,444.2 1,176.9
Parent Company 4,108.1 4,253.0 4,249.9 4,352.3
Guarantors 1,375.0 1,311.8 1,343.5 1,377.0
Non-Guarantors 695.6 769.4 701.8 717.6
Eliminations (1,748.5)(1,901.0)(1,881.5)(1,952.1)
Total liabilities 4,430.2 4,433.2 4,413.7 4,494.8
Parent Company 2,101.3 2,090.4 2,218.0 2,172.3
Guarantors 5,710.4 5,846.6 5,945.7 6,052.5
Non-Guarantors 1,917.8 1,987.0 2,065.3 2,086.4
Eliminations (7,628.2)(7,833.6)(8,011.0)(8,138.9)
Total Stockholders' equity $ 2,101.3 $ 2,090.4 $ 2,218.0 $ 2,172.3
97