Energizer 2012 Annual Report Download - page 3
Download and view the complete annual report
Please find page 3 of the 2012 Energizer annual report below. You can navigate through the pages in the report by either clicking on the pages listed below, or by using the keyword search tool below to find specific information within the annual report.-
 1
1 -
 2
2 -
 3
3 -
 4
4 -
 5
5 -
 6
6 -
 7
7 -
 8
8 -
 9
9 -
 10
10 -
 11
11 -
 12
12 -
 13
13 -
 14
14 -
15
-
16
-
17
-
18
-
19
-
20
-
21
-
22
-
23
-
24
-
25
-
26
-
27
-
28
-
29
-
30
-
31
-
32
-
33
-
34
-
35
-
36
-
37
-
38
-
39
-
40
-
41
-
42
-
43
-
44
-
45
-
46
-
47
-
48
-
49
-
50
-
51
-
52
-
53
-
54
-
55
-
56
-
57
-
58
-
59
-
60
-
61
-
62
-
63
-
64
-
65
-
66
-
67
-
68
-
69
-
70
-
71
-
72
-
73
-
74
-
75
-
76
-
77
-
78
-
79
-
80
-
81
-
82
-
83
-
84
-
85
-
86
-
87
-
88
-
89
-
90
-
91
-
92
-
93
-
94
-
95
-
96
-
97
-
98
-
99
-
100
-
101
-
102
-
103
-
104
-
105
-
106
-
107
-
108
-
109
-
110
-
111
-
112
-
113
-
114
-
115
-
116
-
117
-
118
-
119
-
120
-
121
-
122
-
123
-
124
 |
 |
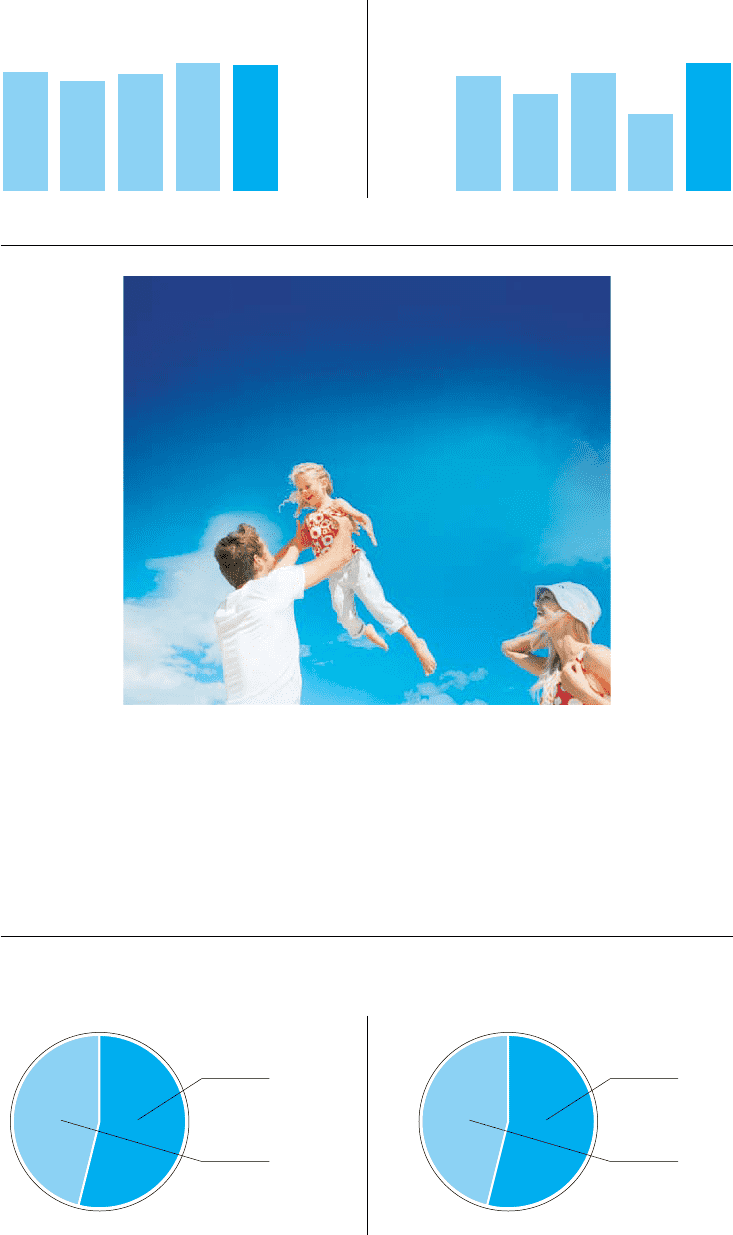
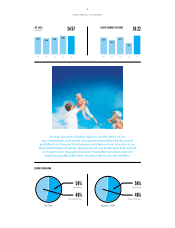
54% 54%
46% 46%
Personal CarePersonal Care
Household ProductsHousehold Products
1
Energizer Holdings, Inc. 2012 Annual Report
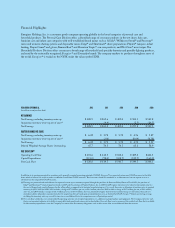
NET SALES
in billions
DILUTED EARNINGS PER SHARE
$4.33 $5.59
$4.00
$4.72
$4.25 $5.72
$4.65
$3.72
$4.57 $6.22
08 0810 1009 0911 1112 12
SEGMENT BREAKDOWN
Net Sales Segment Prot
In 2012, Energizer Holdings began to see the return on our
2011 investments, with record earnings per share driven by the growth
portfolio of our Personal Care business and improved cost structure in our
Household Products business. Going forward, our investments help us build
a stronger, more innovative Energizer that delivers products aimed at
improving quality of life while creating value for our shareholders.