Energizer 2012 Annual Report Download - page 96
Download and view the complete annual report
Please find page 96 of the 2012 Energizer annual report below. You can navigate through the pages in the report by either clicking on the pages listed below, or by using the keyword search tool below to find specific information within the annual report.-
 1
1 -
2
-
3
-
4
-
5
-
6
-
7
-
8
-
9
-
10
-
11
-
12
-
13
-
14
-
15
-
16
-
17
-
18
-
19
-
20
-
21
-
22
-
23
-
24
-
25
-
26
-
27
-
28
-
29
-
30
-
31
-
32
-
33
-
34
-
35
-
36
-
37
-
38
-
39
-
40
-
41
-
42
-
43
-
44
-
45
-
46
-
47
-
48
-
49
-
50
-
51
-
52
-
53
-
54
-
55
-
56
-
57
-
58
-
59
-
60
-
61
-
62
-
63
-
64
-
65
-
66
-
67
-
68
-
69
-
70
-
71
-
72
-
73
-
74
-
75
-
76
-
77
-
78
-
79
-
80
-
81
-
82
-
83
-
84
-
85
-
 86
86 -
 87
87 -
 88
88 -
 89
89 -
 90
90 -
 91
91 -
 92
92 -
 93
93 -
 94
94 -
 95
95 -
 96
96 -
 97
97 -
 98
98 -
 99
99 -
 100
100 -
 101
101 -
 102
102 -
 103
103 -
 104
104 -
 105
105 -
 106
106 -
107
-
108
-
109
-
110
-
111
-
112
-
113
-
114
-
115
-
116
-
117
-
118
-
119
-
120
-
121
-
122
-
123
-
124
 |
 |

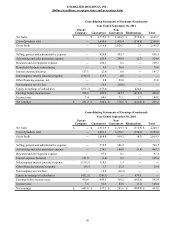
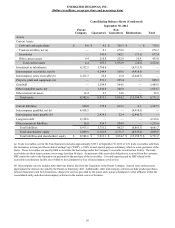
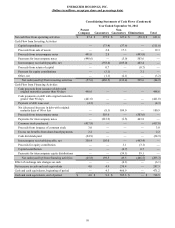
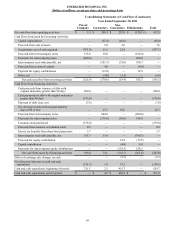
ENERGIZER HOLDINGS, INC.
NOTES TO CONSOLIDATED FINANCIAL STATEMENTS
(Dollars in millions, except per share and percentage data)
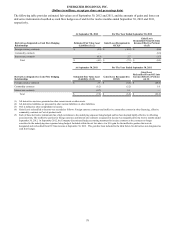
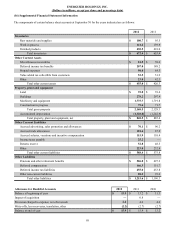
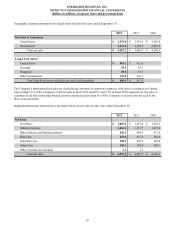
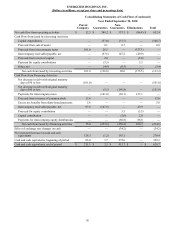
The following table provides segment information for the years ended or at September 30 for the periods presented:
Net Sales 2012 2011 2010
Personal Care $ 2,479.5 $ 2,449.7 $ 2,048.6
Household Products 2,087.7 2,196.0 2,199.7
Total net sales $ 4,567.2 $ 4,645.7 $ 4,248.3
2012 2011 2010
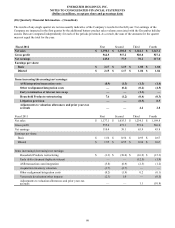
Operating Profit
Personal Care $ 470.7 $ 408.4 $ 366.6
Household Products 400.2 410.6 451.1
Total operating profit 870.9 819.0 817.7
General corporate and other expenses (159.0)(119.9)(108.4)
Household Products restructuring 6.8 (79.0)—
Acquisition inventory valuation —(7.0)—
ASR transaction costs/integration (8.4)(13.5)(0.5)
Amortization of intangibles (22.7)(21.3)(13.6)
Venezuela devaluation/other impacts —(1.8)(18.3)
Cost of early debt retirements —(19.9)—
Interest and other financing items (122.2)(150.6)(133.5)
Total earnings before income taxes $ 565.4 $ 406.0 $ 543.4
Depreciation and Amortization
Personal Care $ 82.0 $ 78.9 $ 57.9
Household Products 54.7 63.5 65.8
Total segment depreciation and amortization 136.7 142.4 123.7
Corporate 25.5 38.9 15.5
Total depreciation and amortization $ 162.2 $ 181.3 $ 139.2
Total Assets
Personal Care $ 1,278.4 $ 1,266.9
Household Products 1,134.4 1,176.7
Total segment assets 2,412.8 2,443.6
Corporate 995.2 734.4
Goodwill and other intangible assets, net 3,323.2 3,353.5
Total assets $ 6,731.2 $ 6,531.5
Capital Expenditures
Personal Care $ 58.3 $ 61.0 $ 69.2
Household Products 38.1 36.6 38.2
Total segment capital expenditures 96.4 97.6 107.4
Corporate 14.6 0.4 1.3
Total capital expenditures $ 111.0 $ 98.0 $ 108.7
86