Energizer 2012 Annual Report Download - page 111
Download and view the complete annual report
Please find page 111 of the 2012 Energizer annual report below. You can navigate through the pages in the report by either clicking on the pages listed below, or by using the keyword search tool below to find specific information within the annual report.-
 1
1 -
2
-
3
-
4
-
5
-
6
-
7
-
8
-
9
-
10
-
11
-
12
-
13
-
14
-
15
-
16
-
17
-
18
-
19
-
20
-
21
-
22
-
23
-
24
-
25
-
26
-
27
-
28
-
29
-
30
-
31
-
32
-
33
-
34
-
35
-
36
-
37
-
38
-
39
-
40
-
41
-
42
-
43
-
44
-
45
-
46
-
47
-
48
-
49
-
50
-
51
-
52
-
53
-
54
-
55
-
56
-
57
-
58
-
59
-
60
-
61
-
62
-
63
-
64
-
65
-
66
-
67
-
68
-
69
-
70
-
71
-
72
-
73
-
74
-
75
-
76
-
77
-
78
-
79
-
80
-
81
-
82
-
83
-
84
-
85
-
86
-
87
-
88
-
89
-
90
-
91
-
92
-
93
-
94
-
95
-
96
-
97
-
98
-
99
-
100
-
 101
101 -
 102
102 -
 103
103 -
 104
104 -
 105
105 -
 106
106 -
 107
107 -
 108
108 -
 109
109 -
 110
110 -
 111
111 -
 112
112 -
 113
113 -
 114
114 -
 115
115 -
 116
116 -
 117
117 -
 118
118 -
 119
119 -
 120
120 -
 121
121 -
122
-
123
-
124
 |
 |

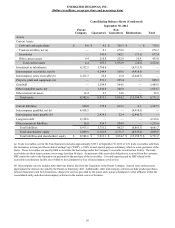
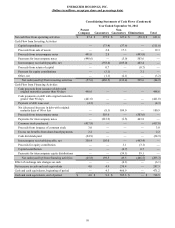
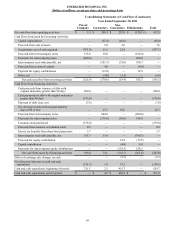
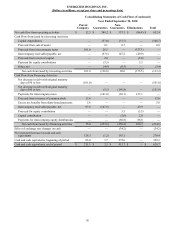
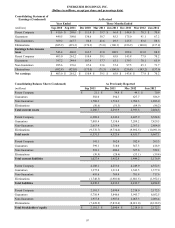
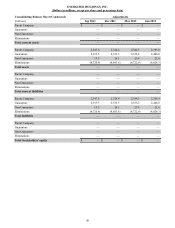
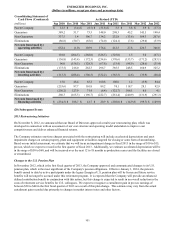
ENERGIZER HOLDINGS, INC.
(Dollars in millions, except per share and percentage data)
Consolidating Statement of
Cash Flows (Condensed) As Revised (YTD)
(millions) Sep 2010 Dec 2010 Mar 2011 Jun 2011 Sep 2011 Dec 2011 Mar 2012 Jun 2012
Parent Company $ 12.5 $ (3.4) $ (8.7)$ (31.8) $ 5.5 $ 3.8 $ 5.9 $ (17.3)
Guarantors 389.2 51.7 73.5 148.0 298.3 45.2 145.5 190.4
Non-Guarantors 337.5 1.4 106.7 134.2 232.8 (13.6) 104.3 207.6
Eliminations (86.8) (50.7) (65.6)(74.0)(124.1)(7.6)(29.0)(33.9)
Net cash from/(used by)
operating activities 652.4 (1.0) 105.9 176.4 412.5 27.8 226.7 346.8
Parent Company 101.0 (204.5) (268.0)(326.5)(325.0) 1.5 3.0 (67.1)
Guarantors (136.8) (143.4) (172.5)(234.6)(370.6)(153.7)(171.2)(283.1)
Non-Guarantors 96.0 (156.5) (128.3)(67.8)(53.4)(98.9)(28.6)(35.4)
Eliminations (173.5) 216.0 262.3 296.7 385.5 248.5 160.9 325.2
Net cash from/(used by)
investing activities (113.3) (288.4) (306.5)(332.2)(363.5)(2.6)(35.9)(60.4)
Parent Company 15.0 48.4 65.2 160.8 108.0 1.2 (3.9) 84.4
Guarantors (253.6) 97.7 101.8 89.2 74.1 118.7 28.1 92.9
Non-Guarantors (256.2) 127.9 71.4 (6.4)(122.7) 106.1 8.0 4.1
Eliminations 260.3 (165.3) (196.7)(222.7)(261.4)(240.9)(131.9)(291.3)
Net cash from/(used by)
financing activities $ (234.5) $ 108.7 $ 41.7 $ 20.9 $ (202.0)$ (14.9)$ (99.7)$ (109.9)
(20) Subsequent Events
2013 Restructuring Initiatives
On November 8, 2012, we announced that our Board of Directors approved a multi-year restructuring plan, which was
developed in connection with an assessment of our cost structure and operating model undertaken to improve cost
competitiveness and deliver enhanced financial returns.
The Company estimates one-time charges associated with the restructuring will include accelerated depreciation and asset
impairment charges on certain property, plant and equipment at facilities targeted for closing or some form of streamlining.
Based on our initial assessment, we estimate that we will incur an impairment charge in fiscal 2013 in the range of $10 to $15,
pre-tax, which we expect to record in the first quarter of fiscal 2013. Additionally, we estimate accelerated depreciation will be
in the range of $50 to $60, and will be incurred over the next 12 to 18 months as production ceases and the facilities are closed
or streamlined.
Changes to the U.S. Pension Plan
In November 2012, which is the first fiscal quarter of 2013, the Company approved and communicated changes to its U.S.
pension plan, which is the most significant of the Company's pension obligations. Effective January 1, 2014, the pension
benefit earned to date by active participants under the legacy Energizer U.S. pension plan will be frozen and future service
benefits will no longer be accrued under this retirement program. It is expected that the Company will provide an enhanced
defined contribution benefit in conjunction with this action, but this change is expected to result in an overall reduction in the
costs of retirement service benefits for U.S. colleagues. We expect to recognize a curtailment gain in pre-tax earnings of
between $30 to $40 in the first fiscal quarter of 2013 as a result of this plan change. This estimate may vary from the actual
curtailment gain recorded due primarily to changes in market interest rates and other factors.
101