Energizer 2012 Annual Report Download - page 47
Download and view the complete annual report
Please find page 47 of the 2012 Energizer annual report below. You can navigate through the pages in the report by either clicking on the pages listed below, or by using the keyword search tool below to find specific information within the annual report.-
 1
1 -
2
-
3
-
4
-
5
-
6
-
7
-
8
-
9
-
10
-
11
-
12
-
13
-
14
-
15
-
16
-
17
-
18
-
19
-
20
-
21
-
22
-
23
-
24
-
25
-
26
-
27
-
28
-
29
-
30
-
31
-
32
-
33
-
34
-
35
-
36
-
 37
37 -
 38
38 -
 39
39 -
 40
40 -
 41
41 -
 42
42 -
 43
43 -
 44
44 -
 45
45 -
 46
46 -
 47
47 -
 48
48 -
 49
49 -
 50
50 -
 51
51 -
 52
52 -
 53
53 -
 54
54 -
 55
55 -
 56
56 -
 57
57 -
58
-
59
-
60
-
61
-
62
-
63
-
64
-
65
-
66
-
67
-
68
-
69
-
70
-
71
-
72
-
73
-
74
-
75
-
76
-
77
-
78
-
79
-
80
-
81
-
82
-
83
-
84
-
85
-
86
-
87
-
88
-
89
-
90
-
91
-
92
-
93
-
94
-
95
-
96
-
97
-
98
-
99
-
100
-
101
-
102
-
103
-
104
-
105
-
106
-
107
-
108
-
109
-
110
-
111
-
112
-
113
-
114
-
115
-
116
-
117
-
118
-
119
-
120
-
121
-
122
-
123
-
124
 |
 |

ENERGIZER HOLDINGS, INC.
(Dollars in millions, except per share and percentage data)
For Fiscal 2010:
• A $23.5 tax benefit related to the favorable impact of a foreign tax credit;
• Adjustments were recorded to reflect refinement of estimates of tax attributes to amounts in filed returns, settlement of
tax audits and other tax adjustments. The fiscal 2010 adjustment decreased the income tax provision by $6.1, and
• A $4.1 tax benefit was recorded in fiscal 2010 reflecting the local tax benefit of the Venezuela devaluation charge.
The Company's effective tax rate is highly sensitive to the mix of countries, from which earnings or losses are derived.
Declines in earnings in lower tax rate countries, earnings increases in higher tax rate countries, repatriation of foreign earnings
or operating losses in the future could increase future tax rates. Additionally, adjustments to prior year tax provision estimates
could increase or decrease future tax provisions.
Segment Results
Operations for the Company are managed via two segments - Personal Care (Wet Shave, Skin Care, Feminine Care and Infant
Care Products) and Household Products (Battery and Portable Lighting Products). On November 23, 2010, which was in the
first quarter of fiscal 2011, we completed the acquisition of ASR. ASR is a leading global manufacturer of private label/value
wet shaving razors and blades, and industrial and specialty blades and is part of the Company' s Personal Care segment. Due to
the timing of the acquisition, we have a full year of operating results for ASR in fiscal 2012, but only ten months in fiscal 2011.
Segment performance is evaluated based on segment operating profit, exclusive of general corporate expenses, share-based
compensation costs, costs associated with most restructuring, acquisition integration or business realignment activities, and
amortization of intangible assets. Financial items, such as interest income and expense, are managed on a global basis at the
corporate level. The exclusion from segment results of charges such as inventory write-up related to purchase accounting, other
acquisition transaction and integration costs, and substantially all restructuring and realignment costs, reflects management’s
view on how it evaluates segment performance.
The Company's operating model includes a combination of stand-alone and combined business functions between the Personal
Care and Household Products businesses, varying by country and region of the world. Shared functions include product
warehousing and distribution, various transaction processing functions, and in some countries, a combined sales force and
management. The Company applies a fully allocated cost basis, in which shared business functions are allocated between the
segments. Such allocations do not represent the costs of such services, if performed on a stand-alone basis.
For the fiscal year ended September 30, 2012, the 2011 Household Products restructuring activities, which were substantially
completed by the end of fiscal 2011, generated pre-tax income of $6.8, which was driven by the gain on the sale of our former
battery manufacturing facility in Switzerland. This plant was closed in fiscal 2011. This gain was partially offset by $6.0 of
additional restructuring costs in fiscal 2012. For the fiscal year ended September 30, 2011, the 2011 Household Products
restructuring activities generated pre-tax expense of $79.0.
This structure is the basis for the Company’s reportable operating segment information, as included in the tables in Note 17 to
the Consolidated Financial Statements for the fiscal years ended September 30, 2012, 2011 and 2010.
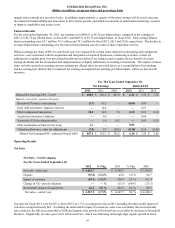
PERSONAL CARE
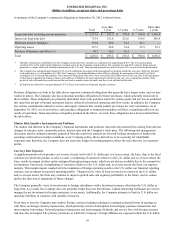
Net Sales - Personal Care Products
For the years ended September 30,
2012 % Chg 2011 % Chg 2010
Net sales - prior year $ 2,449.7 $ 2,048.6 $ 1,890.3
Organic growth 15.0 0.6 % 91.9 4.5 % 34.8
Impact of currency (31.4) (1.3)% 53.5 2.6 % 43.7
Change in VZ - post devaluation ——% (6.6) (0.3)% (9.9)
Incremental impact of acquisitions 46.2 1.9 % 262.3 12.8 % 89.7
Net sales - current year $ 2,479.5 1.2 % $ 2,449.7 19.6 % $ 2,048.6
Net sales for the fiscal year ended September 30, 2012 increased 1.2% , which includes a full twelve months for ASR in fiscal
2012 as compared to only ten months in fiscal 2011 due to the timing of the acquisition, partially offset by the unfavorable
37