Energizer 2012 Annual Report Download - page 2
Download and view the complete annual report
Please find page 2 of the 2012 Energizer annual report below. You can navigate through the pages in the report by either clicking on the pages listed below, or by using the keyword search tool below to find specific information within the annual report.-
 1
1 -
 2
2 -
 3
3 -
 4
4 -
 5
5 -
 6
6 -
 7
7 -
 8
8 -
 9
9 -
 10
10 -
 11
11 -
 12
12 -
 13
13 -
14
-
15
-
16
-
17
-
18
-
19
-
20
-
21
-
22
-
23
-
24
-
25
-
26
-
27
-
28
-
29
-
30
-
31
-
32
-
33
-
34
-
35
-
36
-
37
-
38
-
39
-
40
-
41
-
42
-
43
-
44
-
45
-
46
-
47
-
48
-
49
-
50
-
51
-
52
-
53
-
54
-
55
-
56
-
57
-
58
-
59
-
60
-
61
-
62
-
63
-
64
-
65
-
66
-
67
-
68
-
69
-
70
-
71
-
72
-
73
-
74
-
75
-
76
-
77
-
78
-
79
-
80
-
81
-
82
-
83
-
84
-
85
-
86
-
87
-
88
-
89
-
90
-
91
-
92
-
93
-
94
-
95
-
96
-
97
-
98
-
99
-
100
-
101
-
102
-
103
-
104
-
105
-
106
-
107
-
108
-
109
-
110
-
111
-
112
-
113
-
114
-
115
-
116
-
117
-
118
-
119
-
120
-
121
-
122
-
123
-
124
 |
 |

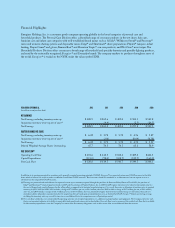
Financial Highlights
Energizer Holdings, Inc. is a consumer goods company operating globally in the broad categories of personal care and
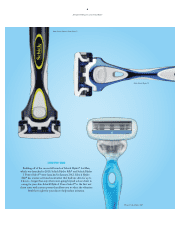
household products. e Personal Care Division oers a diversied range of consumer products in the wet shave, skin care,
feminine care and infant care categories with well-established brand names such as Schick®, Wilkinson Sword® and Personna®
men’s and women’s shaving systems and disposable razors; Edge® and Skintimate® shave preparations; Playtex® tampons, infant
feeding, Diaper Genie® and gloves; Banana Boat® and Hawaiian Tropic® sun care products; and Wet Ones® moist wipes. e
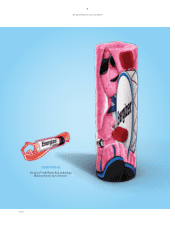
Household Products Division oers consumers a broad range of household and specialty batteries and portable lighting products,
anchored by the universally recognized Energizer® and Eveready® brands. e company markets its products throughout most of
the world. Energizer® is traded on the NYSE under the ticker symbol ENR.
In addition to its earnings presented in accordance with generally accepted accounting principles (GAAP), Energizer® has presented certain non-GAAP measures in the table
above, which it believes are useful to readers in addition to traditional GAAP measures. ese measures should be considered as an alternative to, but not superior to or as a
substitute for, the comparable GAAP measures.
(a) Earnings are presented with and without the impact of a write-up on inventory acquired through the purchase of American Safety Razor in Fiscal 2011, the purchase of
Edge® and Skintimate® shave preparation brands in 2009 and the purchase of Playtex Products, Inc. in 2008. GAAP requires inventory to be valued at fair market value less
the cost of disposal and a prot allowance for the selling eort, as opposed to its historical manufacturing cost. As a result, there was an allocation of purchase price to acquired
inventory in 2011, 2009 and 2008. 2011 includes a charge of $7.0 million, pre-tax, or $4.4 million, after-tax. 2009 includes a charge of $3.7 million, pre-tax, or $2.3 million,
after-tax, and 2008 includes a charge of $27.5 million, pre-tax, or $16.5 million, after-tax, all related to higher than historical manufacturing cost. Inventory value and cost
of product sold for all product manufactured after the acquisition date are based upon actual production costs, as dictated by GAAP. Energizer® believes presenting earnings
excluding the inventory write-up is useful to investors as an additional basis for comparison across all periods presented.
(b) Free cash ow is dened as net cash provided by operating activities net of capital expenditures, i.e., additions to property, plant and equipment. e Company views free cash
ow as an important indicator of its ability to repay debt, fund growth and return cash to shareholders. Free cash ow is not a measure of the residual cash ow that is available
for discretionary expenditures, since the Company has certain non-discretionary obligations, such as debt service, that are not deducted from the measure.
YEAR ENDED SEPTEMBER 30, 2012 2011 2010 2009 2008
(in millions, except per share data)
NET EARNINGS
Net Earnings, excluding inventory write-up $ 408.9 $ 265.6 $ 403.0 $ 300.1 $ 345.8
Acquisition inventory write-up, net of taxes(a) (4.4) (2.3) (16.5)
Net Earnings $ 408.9 $ 261.2 $ 403.0 $ 297.8 $ 329.3
DILUTED EARNINGS PER SHARE
Net Earnings, excluding inventory write-up $ 6.22 $ 3.78 $ 5.72 $ 4.76 $ 5.87
Acquisition inventory write-up, net of taxes(a) (.06) (0.04) (0.28)
Net Earnings $ 6.22 $ 3.72 $ 5.72 $ 4.72 $ 5.59
Diluted Weighted-Average Shares Outstanding 65.7 70.3 70.5 63.1 58.9
FREE CASH FLOW(b)
Operating Cash Flow $ 631.6 $ 412.5 $ 652.4 $ 489.2 $466.5
Capital Expenditures (111.0) (98.0) (108.7) (139.7) (160.0)
Free Cash Flow $ 520.6 $ 314.5 $ 543.7 $ 349.5 $ 306.5