Energizer 2012 Annual Report Download - page 45
Download and view the complete annual report
Please find page 45 of the 2012 Energizer annual report below. You can navigate through the pages in the report by either clicking on the pages listed below, or by using the keyword search tool below to find specific information within the annual report.-
 1
1 -
2
-
3
-
4
-
5
-
6
-
7
-
8
-
9
-
10
-
11
-
12
-
13
-
14
-
15
-
16
-
17
-
18
-
19
-
20
-
21
-
22
-
23
-
24
-
25
-
26
-
27
-
28
-
29
-
30
-
31
-
32
-
33
-
34
-
 35
35 -
 36
36 -
 37
37 -
 38
38 -
 39
39 -
 40
40 -
 41
41 -
 42
42 -
 43
43 -
 44
44 -
 45
45 -
 46
46 -
 47
47 -
 48
48 -
 49
49 -
 50
50 -
 51
51 -
 52
52 -
 53
53 -
 54
54 -
 55
55 -
56
-
57
-
58
-
59
-
60
-
61
-
62
-
63
-
64
-
65
-
66
-
67
-
68
-
69
-
70
-
71
-
72
-
73
-
74
-
75
-
76
-
77
-
78
-
79
-
80
-
81
-
82
-
83
-
84
-
85
-
86
-
87
-
88
-
89
-
90
-
91
-
92
-
93
-
94
-
95
-
96
-
97
-
98
-
99
-
100
-
101
-
102
-
103
-
104
-
105
-
106
-
107
-
108
-
109
-
110
-
111
-
112
-
113
-
114
-
115
-
116
-
117
-
118
-
119
-
120
-
121
-
122
-
123
-
124
 |
 |

ENERGIZER HOLDINGS, INC.
(Dollars in millions, except per share and percentage data)
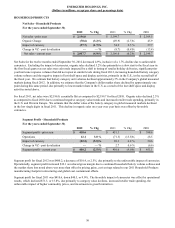
2011 as the prior year included continued launch activities for Schick Hydro. Organically, net sales in Household Products
declined 3.2% in fiscal 2012 due, in part, to continued category softness and a loss in market share, primarily in the U.S., due to
lost shelf space and display activities.
Net sales for fiscal 2011 were $4,645.7, an increase of $397.4, or 9.4%, as compared to fiscal 2010, due primarily to the
inclusion of ASR and the favorable impacts of currencies. On an organic basis, net sales for the fiscal year increased 1.0% as
higher sales in Personal Care due, in part, to the Schick Hydro launch, higher sales of disposable razors and increased revenue
in Skin Care were offset by declines in Household Products and legacy men's razor systems.
For further discussion regarding net sales in Personal Care and Household Products, please see the section titled “Segment
Results” provided below.
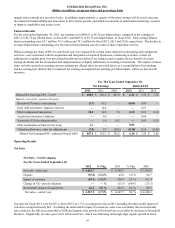
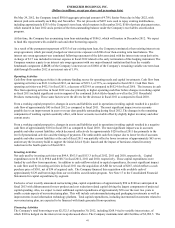
Gross Profit
Gross profit dollars were $2,137.9 in fiscal 2012, $2,145.7 in fiscal 2011 and $2,019.3 in fiscal 2010. The slight decrease in
gross profit in fiscal 2012 as compared to fiscal 2011 was due to the decline in net sales noted above including the negative
impact of unfavorable currencies, partially offset by improved gross margin as a percent of net sales.
Gross Margin as a percent of net sales for fiscal 2012 was 46.8%, up approximately 60 basis points as compared to fiscal 2011.
This increase in gross margin as a percent of net sales was more pronounced excluding the unfavorable impact of currencies,
which negatively impacted the year over year comparison by approximately 40 basis points. Exclusive of the unfavorable
impact of currencies, gross margin as a percent of net sales improved approximately 100 basis points in fiscal 2012 due
primarily to improved product costs, including savings from the 2011 Household Products manufacturing footprint changes,
and the impact of favorable pricing and product costs in Personal Care.
Gross margin as a percent of net sales was 46.2% in fiscal 2011 and 47.5% in fiscal 2010. The decrease in fiscal 2011 was due
primarily to the inclusion of lower margin ASR products, which reduced gross margin by approximately 130 basis points
during the period as compared to fiscal 2010. In addition, higher commodity costs primarily in batteries, and higher
introductory coupon and trade promotion related to the Schick Hydro launch were offset by favorable currencies and product
mix.
Selling, General and Administrative
Selling, general and administrative expenses (SG&A) were $895.1, or 19.6% of net sales as compared to $856.1, or 18.4% of
net sales for fiscal 2011. The dollar increase of $39.0 includes approximately $7 for costs associated with the Company's
recent enterprise-wide review of its operating model and cost structure. In addition, fiscal 2012 includes higher costs of
approximately $13, as compared to fiscal 2011, related to the increase in the underlying value of the Company's unfunded
deferred compensation liabilities due to the increase in the value of market securities. Other increases in SG&A for fiscal 2012
as compared to 2011 included pension expense, up approximately $7, due primarily to the impact of lower market interest rates
on the value of pension liabilities and higher incentive compensation, as short and long term performance targets were achieved
in fiscal 2012 and were not achieved in fiscal 2011 due, in part, to our prior year strategic investments.
Advertising and Sales Promotion
For fiscal 2012, advertising and sales promotion (A&P) was $449.5, down $74.5 as compared to fiscal 2011. A&P as a percent
of net sales for fiscal 2012 was 9.8% as compared to 11.3% of net sales in fiscal 2011. The prior fiscal year included significant
A&P spending related to the continued launch of Schick Hydro. We planned for A&P spending to return closer to pre-launch
levels in fiscal 2012. The Schick Hydro launch was initiated in North America in April 2010.
A&P expense was 9.8%, 11.3% and 10.9% of sales for fiscal 2012, 2011 and 2010, respectively. The higher level of A&P
spending in relation to net sales in fiscal 2011 and 2010 was due to significant launch activities for Schick Hydro. A&P
expense may vary from year to year with new product launches, the impact of acquisitions, strategic brand support initiatives,
the overall competitive environment, and the state of the global economy.
Research and Development
Research and development (R&D) expense was $112.5 in fiscal 2012, $108.3 in fiscal 2011 and $97.1 in fiscal 2010. The
increase in fiscal 2012 was due primarily to normal cost increases including salary merit increases. The increase in fiscal 2011
as compared to fiscal 2010 reflects the inclusion of ASR, which added approximately $7. As a percent of sales, R&D expense
was approximately 2.5% in fiscal 2012 and 2.3% for both fiscal 2011 and 2010.
35