Energizer 2012 Annual Report Download - page 61
Download and view the complete annual report
Please find page 61 of the 2012 Energizer annual report below. You can navigate through the pages in the report by either clicking on the pages listed below, or by using the keyword search tool below to find specific information within the annual report.-
 1
1 -
2
-
3
-
4
-
5
-
6
-
7
-
8
-
9
-
10
-
11
-
12
-
13
-
14
-
15
-
16
-
17
-
18
-
19
-
20
-
21
-
22
-
23
-
24
-
25
-
26
-
27
-
28
-
29
-
30
-
31
-
32
-
33
-
34
-
35
-
36
-
37
-
38
-
39
-
40
-
41
-
42
-
43
-
44
-
45
-
46
-
47
-
48
-
49
-
50
-
 51
51 -
 52
52 -
 53
53 -
 54
54 -
 55
55 -
 56
56 -
 57
57 -
 58
58 -
 59
59 -
 60
60 -
 61
61 -
 62
62 -
 63
63 -
 64
64 -
 65
65 -
 66
66 -
 67
67 -
 68
68 -
 69
69 -
 70
70 -
 71
71 -
72
-
73
-
74
-
75
-
76
-
77
-
78
-
79
-
80
-
81
-
82
-
83
-
84
-
85
-
86
-
87
-
88
-
89
-
90
-
91
-
92
-
93
-
94
-
95
-
96
-
97
-
98
-
99
-
100
-
101
-
102
-
103
-
104
-
105
-
106
-
107
-
108
-
109
-
110
-
111
-
112
-
113
-
114
-
115
-
116
-
117
-
118
-
119
-
120
-
121
-
122
-
123
-
124
 |
 |

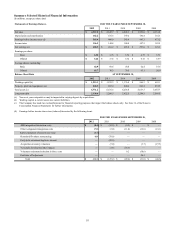
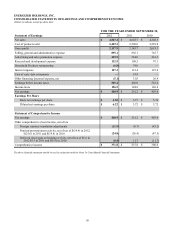
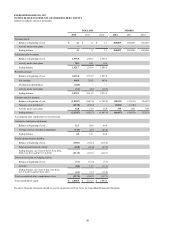
Summary Selected Historical Financial Information
(In millions, except per share data)
Statements of Earnings Data (a) FOR THE YEARS ENDED SEPTEMBER 30,
2012 2011 2010 2009 2008
Net sales $ 4,567.2 $ 4,645.7 $ 4,248.3 $ 3,999.8 $ 4,331.0
Depreciation and amortization 162.2 181.3 139.2 130.4 141.3
Earnings before income taxes (d) 565.4 406.0 543.4 445.3 473.2
Income taxes 156.5 144.8 140.4 147.5 143.9
Net earnings (e) $ 408.9 $ 261.2 $ 403.0 $ 297.8 $ 329.3
Earnings per share:
Basic $ 6.30 $ 3.75 $ 5.76 $ 4.77 $ 5.71
Diluted $ 6.22 $ 3.72 $ 5.72 $ 4.72 $ 5.59
Average shares outstanding:
Basic 64.9 69.6 70.0 62.4 57.6
Diluted 65.7 70.3 70.5 63.1 58.9
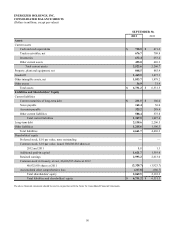
Balance Sheet Data AT SEPTEMBER 30,
2012 2011 2010 2009 2008
Working capital (b) $ 1,215.1 $ 1,233.3 $ 1,176.0 $ 966.3 $ 665.1
Property, plant and equipment, net 848.5 885.4 840.6 863.4 835.5
Total assets (c) 6,731.2 6,531.5 6,255.8 6,017.3 5,667.7
Long-term debt 2,138.6 2,206.5 2,022.5 2,288.5 2,589.5
(a) Year over year comparatives may be impacted in varying degrees by acquisitions.
(b) Working capital is current assets less current liabilities.
(c) The Company has made two reclassifications for financial reporting purposes that impact the balance sheets only. See Note 16 of the Notes to
Consolidated Financial Statements for further information.
(d) Earnings before income taxes were (reduced)/increased by the following items:
FOR THE YEARS ENDED SEPTEMBER 30,
2012 2011 2010 2009 2008
ASR integration/transaction costs $ (8.4) $ (13.5) $ (0.5) $ — $ —
Other realignment/integration costs (7.8) (3.0) (11.0) (13.6) (21.1)
Early termination of interest rate swap (1.7) — ———
Household Products restructuring 6.8 (79.0) — — —
Early debt retirement/duplicate interest —(22.9) — — —
Acquisition inventory valuation —(7.0) — (3.7) (27.5)
Venezuela devaluation/other impacts —(1.8) (18.3) — —
Voluntary retirement/reduction in force costs —— 0.2 (38.6) —
Paid time off adjustment —— — 24.1 —
Total $ (11.1) $ (127.2) $ (29.6) $ (31.8) $ (48.6)
51