Energizer 2012 Annual Report Download - page 109
Download and view the complete annual report
Please find page 109 of the 2012 Energizer annual report below. You can navigate through the pages in the report by either clicking on the pages listed below, or by using the keyword search tool below to find specific information within the annual report.
ENERGIZER HOLDINGS, INC.
(Dollars in millions, except per share and percentage data)
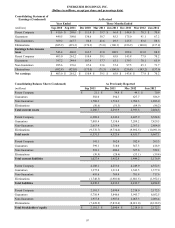
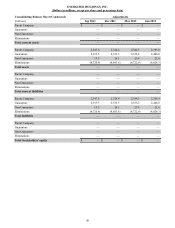
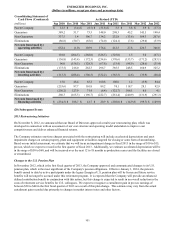
Consolidating Balance Sheet (Condensed) As Revised
(millions) Sep 2011 Dec 2011 Mar 2012 Jun 2012
Parent Company $ 21.1 $ 34.8 $ 44.5 $ 70.9
Guarantors 582.0 594.3 627.7 586.9
Non-Guarantors 1,708.2 1,716.3 1,786.3 1,893.0
Eliminations (50.6)(51.5)(64.9)(86.2)
Total current assets 2,260.7 2,293.9 2,393.6 2,464.6
Parent Company 8,557.0 8,667.8 8,812.2 8,920.5
Guarantors 9,438.9 9,493.7 9,644.4 9,836.3
Non-Guarantors 2,632.7 2,780.5 2,790.5 2,825.6
Eliminations (14,097.1)(14,418.4)(14,615.4)(14,915.3)
Total assets 6,531.5 6,523.6 6,631.7 6,667.1
Parent Company 141.1 562.8 582.4 265.3
Guarantors 399.1 318.0 367.3 418.9
Non-Guarantors 518.1 600.4 527.6 552.1
Eliminations (30.9)(28.4)(33.1)(59.4)
Total current liabilities 1,027.4 1,452.8 1,444.2 1,176.9
Parent Company 6,455.7 6,577.4 6,594.2 6,748.2
Guarantors 3,728.5 3,647.1 3,698.7 3,783.8
Non-Guarantors 714.9 793.5 725.2 739.2
Eliminations (6,468.9)(6,584.8)(6,604.4)(6,776.4)
Total liabilities 4,430.2 4,433.2 4,413.7 4,494.8
Parent Company 2,101.3 2,090.4 2,218.0 2,172.3
Guarantors 5,710.4 5,846.6 5,945.7 6,052.5
Non-Guarantors 1,917.8 1,987.0 2,065.3 2,086.4
Eliminations (7,628.2)(7,833.6)(8,011.0)(8,138.9)
Total Stockholders' equity $ 2,101.3 $ 2,090.4 $ 2,218.0 $ 2,172.3
99


