Energizer 2012 Annual Report Download - page 50
Download and view the complete annual report
Please find page 50 of the 2012 Energizer annual report below. You can navigate through the pages in the report by either clicking on the pages listed below, or by using the keyword search tool below to find specific information within the annual report.-
 1
1 -
2
-
3
-
4
-
5
-
6
-
7
-
8
-
9
-
10
-
11
-
12
-
13
-
14
-
15
-
16
-
17
-
18
-
19
-
20
-
21
-
22
-
23
-
24
-
25
-
26
-
27
-
28
-
29
-
30
-
31
-
32
-
33
-
34
-
35
-
36
-
37
-
38
-
39
-
 40
40 -
 41
41 -
 42
42 -
 43
43 -
 44
44 -
 45
45 -
 46
46 -
 47
47 -
 48
48 -
 49
49 -
 50
50 -
 51
51 -
 52
52 -
 53
53 -
 54
54 -
 55
55 -
 56
56 -
 57
57 -
 58
58 -
 59
59 -
 60
60 -
61
-
62
-
63
-
64
-
65
-
66
-
67
-
68
-
69
-
70
-
71
-
72
-
73
-
74
-
75
-
76
-
77
-
78
-
79
-
80
-
81
-
82
-
83
-
84
-
85
-
86
-
87
-
88
-
89
-
90
-
91
-
92
-
93
-
94
-
95
-
96
-
97
-
98
-
99
-
100
-
101
-
102
-
103
-
104
-
105
-
106
-
107
-
108
-
109
-
110
-
111
-
112
-
113
-
114
-
115
-
116
-
117
-
118
-
119
-
120
-
121
-
122
-
123
-
124
 |
 |

ENERGIZER HOLDINGS, INC.
(Dollars in millions, except per share and percentage data)
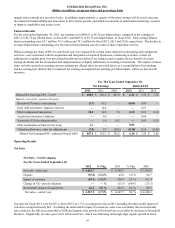
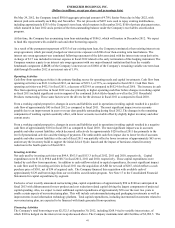
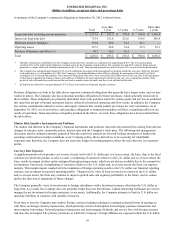
GENERAL CORPORATE AND OTHER EXPENSES
For The Years Ended September 30,
2012 2011 2010
General corporate expenses $ 151.2 $ 116.9 $ 97.6
Integration/other realignment 7.8 3.0 10.8
Sub-Total 159.0 119.9 108.4
Household Products restructuring (6.8) 79.0 —
ASR costs:
Deal expenses —4.2 0.5
Severance/other integration 8.4 9.3 —
Acquisition inventory valuation —7.0 —
General corporate and other expenses $ 160.6 $ 219.4 $ 108.9
% of net sales 3.5% 4.7% 2.6%
General Corporate and Other Expenses
For fiscal 2012, general corporate expenses, including integration/other realignment, were $159.0 an increase of $39.1 as
compared to fiscal 2011, due primarily to higher corporate expenses including:
• increased costs of approximately $13 due to the year over year change in the underlying value of the Company's
unfunded deferred compensation liabilities driven by the increase in the value of market securities,
• higher pension costs of approximately $7 due primarily to the unfavorable impact of lower market discount rates on
the actuarial value of pension liabilities due to the changes in the value of market securities,
• higher annual bonus and stock award compensation of approximately $14 as short and long term performance targets
were achieved in fiscal 2012 and were not achieved in fiscal 2011 due, in part, to our prior year strategic investments,
and
• higher integration/other realignment costs in fiscal 2012, which included approximately $7 associated with the
assessment phase of our 2013 restructuring plan.
The increase in general corporate expenses inclusive of integration/other realignment costs in fiscal 2012 as compared to fiscal
2011was more than offset by significantly lower costs in fiscal 2012 associated with the 2011 Household Products restructuring
and lower ASR transaction, integration and inventory write-up costs.
For fiscal 2011, general corporate expenses, including integration/other realignment, were $119.9, an increase of $11.3 as
compared to fiscal 2010, due primarily to higher corporate compensation expenses, most notably higher stock award
amortization and higher pension expenses due primarily to the decline in market discount rates, which results in an increase in
the actuarial value of pension liabilities. This was partially offset by lower integration and other realignment costs, exclusive of
the 2011 Household Products restructuring, which is included on a separate line in the above table. In fiscal 2011, the Company
incurred $13.5 of ASR transaction and integration expenses and $7.0 of costs associated with the write-up and subsequent sale
of the acquired ASR inventory.
Liquidity and Capital Resources
At September 30, 2012, the Company had $718.5 in available cash, the vast majority of which was outside of the U.S. and
$438.9 available under its committed debt facilities, exclusive of available borrowings under the receivables securitization
program.
Advances under the Company's existing receivables securitization program, which may not exceed $200, are not considered
debt for purposes of the Company’s debt compliance covenants. At September 30, 2012, $140.0 was outstanding under this
facility.
The Company's Revolving Credit Agreement currently provides for revolving credit loans and the issuance of letters of credit
in an aggregate amount of up to $450. We have no outstanding borrowings under our revolving credit facility, and $438.9
remains available as of September 30, 2012, including $11.1 of outstanding letters of credit.
40