Dish Network 2015 Annual Report Download - page 83
Download and view the complete annual report
Please find page 83 of the 2015 Dish Network annual report below. You can navigate through the pages in the report by either clicking on the pages listed below, or by using the keyword search tool below to find specific information within the annual report.-
 1
1 -
2
-
3
-
4
-
5
-
6
-
7
-
8
-
9
-
10
-
11
-
12
-
13
-
14
-
15
-
16
-
17
-
18
-
19
-
20
-
21
-
22
-
23
-
24
-
25
-
26
-
27
-
28
-
29
-
30
-
31
-
32
-
33
-
34
-
35
-
36
-
37
-
38
-
39
-
40
-
41
-
42
-
43
-
44
-
45
-
46
-
47
-
48
-
49
-
50
-
51
-
52
-
53
-
54
-
55
-
56
-
57
-
58
-
59
-
60
-
61
-
62
-
63
-
64
-
65
-
66
-
67
-
68
-
69
-
70
-
71
-
72
-
 73
73 -
 74
74 -
 75
75 -
 76
76 -
 77
77 -
 78
78 -
 79
79 -
 80
80 -
 81
81 -
 82
82 -
 83
83 -
 84
84 -
 85
85 -
 86
86 -
 87
87 -
 88
88 -
 89
89 -
 90
90 -
 91
91 -
 92
92 -
 93
93 -
94
-
95
-
96
-
97
-
98
-
99
-
100
-
101
-
102
-
103
-
104
-
105
-
106
-
107
-
108
-
109
-
110
-
111
-
112
-
113
-
114
-
115
-
116
-
117
-
118
-
119
-
120
-
121
-
122
-
123
-
124
-
125
-
126
-
127
-
128
-
129
-
130
-
131
-
132
-
133
-
134
-
135
-
136
-
137
-
138
-
139
-
140
-
141
-
142
-
143
-
144
-
145
-
146
-
147
-
148
-
149
-
150
-
151
-
152
-
153
-
154
-
155
-
156
-
157
-
158
-
159
-
160
-
161
-
162
-
163
-
164
-
165
-
166
-
167
-
168
-
169
-
170
-
171
-
172
-
173
-
174
-
175
-
176
-
177
-
178
-
179
-
180
-
181
-
182
-
183
-
184
-
185
-
186
-
187
-
188
 |
 |

73
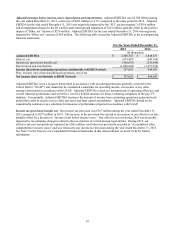
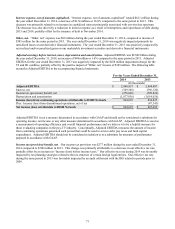
The following table reconciles adjusted free cash flow to “Net cash flows from operating activities from continuing
operations.”
For the Years Ended December 31,
2015 2014 2013
(In thousands)
Net cash flows from operating activities from continuing operations $ 2,436,080 $ 2,408,131 $ 2,309,197
Less Purchases of property and equipment (including capitalized interest
related to FCC authorizations) (1,114,377) (1,215,861) (1,253,499)
Adjusted free cash flow $ 1,321,703 $ 1,192,270 $ 1,055,698
The increase in adjusted free cash flow from 2014 to 2015 of $129 million primarily resulted from an increase in “Net
cash flows from operating activities from continuing operations” of $28 million and from a decrease in “Purchases of
property and equipment (including capitalized interest related to FCC authorizations)” of $101 million. The decrease in
“Purchases of property and equipment (including capitalized interest related to FCC authorizations)” in 2015 was
primarily attributable to a decrease in expenditures for equipment under our lease programs for new and existing DISH
branded pay-TV and Broadband subscribers and in satellite construction, partially offset by an increase in capitalized
interest related to FCC authorizations. The increase in “Net cash flows from operating activities from continuing
operations” was primarily attributable to an increase in cash resulting from changes in operating assets and liabilities
principally attributable to timing differences between book expense and cash payments, including income taxes. This
increase was partially offset by a $390 million decrease in income from continuing operations adjusted to exclude non-
cash charges for “Realized and unrealized losses (gains) on investments,” “Impairment of long-lived assets,”
“Depreciation and amortization” expense and “Deferred tax expense (benefit).” Included in this amount is the $516
million payment related to the “FCC auction expense.”
The increase in adjusted free cash flow from 2013 to 2014 of $137 million primarily resulted from an increase in “Net
cash flows from operating activities from continuing operations” of $99 million and from a decrease in “Purchases of
property and equipment (including capitalized interest related to FCC authorizations)” of $38 million. The decrease in
“Purchases of property and equipment (including capitalized interest related to FCC authorizations)” in 2014 was
primarily attributable to a decrease in expenditures for equipment under our lease programs for new and existing Pay-TV
and Broadband subscribers, partially offset by an increase in capitalized interest related to FCC authorizations and in
satellite construction. The increase in “Net cash flows from operating activities from continuing operations” was
primarily attributable to a $135 million increase in income from continuing operations adjusted to exclude non-cash
charges for “Realized and unrealized losses (gains) on investments,” “Impairment of long-lived assets,” “Depreciation
and amortization” expense and “Deferred tax expense (benefit).” This increase was partially offset by a decrease in cash
resulting from changes in operating assets and liabilities principally attributable to timing differences between book
expense and cash payments.
Cash flows from operating activities from continuing operations. We typically reinvest the cash flow from operating
activities in our business primarily to grow our subscriber base, expand our infrastructure, make strategic investments
and repay debt obligations. For the years ended December 31, 2015, 2014 and 2013, we reported “Net cash flows from
operating activities from continuing operations” of $2.436 billion, $2.408 billion, and $2.309 billion, respectively. See
discussion of changes in “Net cash flows from operating activities from continuing operations” included in “Adjusted
free cash flow” above.
Cash flows from investing activities from continuing operations. Our investing activities generally include purchases
and sales of marketable investment securities, acquisitions, strategic investments, including purchases and settlements of
derivative financial instruments and purchases of spectrum licenses, and cash used to grow our subscriber base and
expand our infrastructure. For the years ended December 31, 2015, 2014 and 2013, we reported “Net cash outflows
from investing activities from continuing operations” of $8.074 billion, $984 million and $3.035 billion, respectively.
During the years ended December 31, 2015, 2014 and 2013, capital expenditures for new and existing DISH branded
pay-TV customer equipment totaled $573 million, $755 million and $852 million, respectively. During the years ended
December 31, 2015, 2014 and 2013, capital expenditures for new and existing broadband customer equipment totaled