Dish Network 2015 Annual Report Download - page 186
Download and view the complete annual report
Please find page 186 of the 2015 Dish Network annual report below. You can navigate through the pages in the report by either clicking on the pages listed below, or by using the keyword search tool below to find specific information within the annual report.-
 1
1 -
2
-
3
-
4
-
5
-
6
-
7
-
8
-
9
-
10
-
11
-
12
-
13
-
14
-
15
-
16
-
17
-
18
-
19
-
20
-
21
-
22
-
23
-
24
-
25
-
26
-
27
-
28
-
29
-
30
-
31
-
32
-
33
-
34
-
35
-
36
-
37
-
38
-
39
-
40
-
41
-
42
-
43
-
44
-
45
-
46
-
47
-
48
-
49
-
50
-
51
-
52
-
53
-
54
-
55
-
56
-
57
-
58
-
59
-
60
-
61
-
62
-
63
-
64
-
65
-
66
-
67
-
68
-
69
-
70
-
71
-
72
-
73
-
74
-
75
-
76
-
77
-
78
-
79
-
80
-
81
-
82
-
83
-
84
-
85
-
86
-
87
-
88
-
89
-
90
-
91
-
92
-
93
-
94
-
95
-
96
-
97
-
98
-
99
-
100
-
101
-
102
-
103
-
104
-
105
-
106
-
107
-
108
-
109
-
110
-
111
-
112
-
113
-
114
-
115
-
116
-
117
-
118
-
119
-
120
-
121
-
122
-
123
-
124
-
125
-
126
-
127
-
128
-
129
-
130
-
131
-
132
-
133
-
134
-
135
-
136
-
137
-
138
-
139
-
140
-
141
-
142
-
143
-
144
-
145
-
146
-
147
-
148
-
149
-
150
-
151
-
152
-
153
-
154
-
155
-
156
-
157
-
158
-
159
-
160
-
161
-
162
-
163
-
164
-
165
-
166
-
167
-
168
-
169
-
170
-
171
-
172
-
173
-
174
-
175
-
 176
176 -
 177
177 -
 178
178 -
 179
179 -
 180
180 -
 181
181 -
 182
182 -
 183
183 -
 184
184 -
 185
185 -
 186
186 -
 187
187 -
 188
188
 |
 |
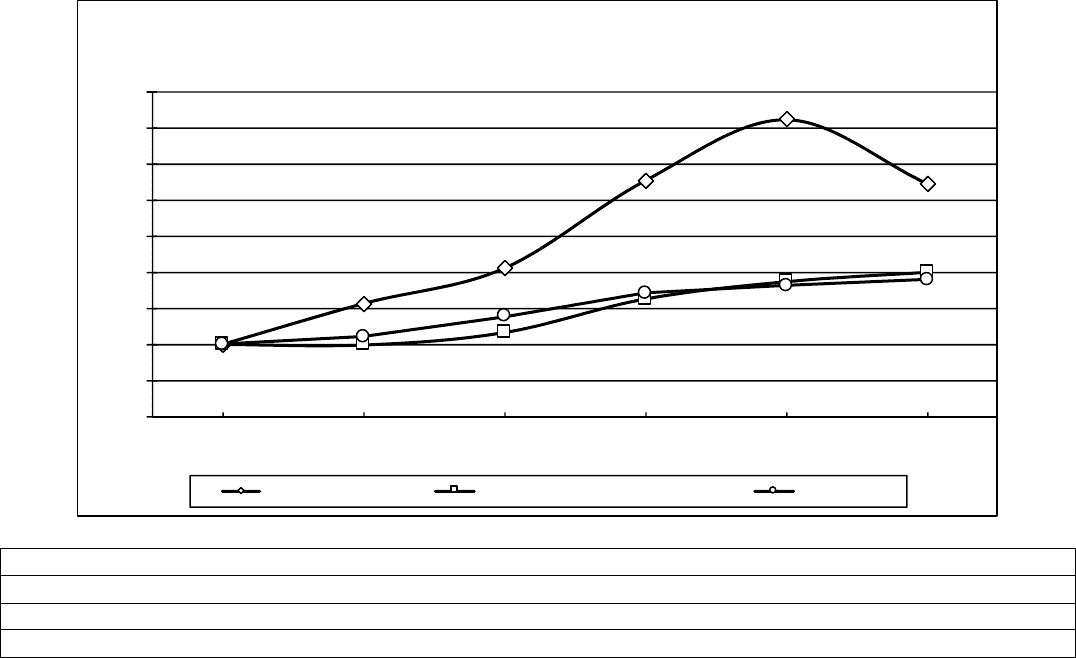
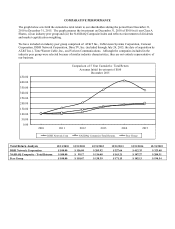
COMPARATIVE PERFORMANCE
The graph below sets forth the cumulative total return to our shareholders during the period from December 31,
2010 to December 31, 2015. The graph assumes the investment on December 31, 2010 of $100 in (i) our Class A
Shares, (ii) an industry peer group and (iii) the NASDAQ Composite Index and reflects reinvestment of dividends
and market capitalization weighting.
We have included an industry peer group comprised of: AT&T Inc., Cablevision Systems Corporation, Comcast
Corporation, DISH Network Corporation, DirecTV, Inc. (included through July 24, 2015, the date of acquisition by
AT&T Inc.), Time Warner Cable, Inc., and Verizon Communications. Although the companies included in the
industry peer group were selected because of similar industry characteristics, they are not entirely representative of
our business.
Total Return Analysis 12/31/2010 12/31/2011 12/31/2012 12/31/2013 12/31/2014 12/31/2015
DISH Network Corporation $ 100.00 $ 156.84 $ 205.92 $ 327.66 $ 412.35 $ 323.48
NASDAQ Composite – Total Returns $ 100.00 $ 99.17 $ 116.48 $ 163.21 $ 187.27 $ 200.31
Peer Group $ 100.00 $ 110.67 $ 138.39 $ 171.15 $ 182.13 $ 190.54
0.00
50.00
100.00
150.00
200.00
250.00
300.00
350.00
400.00
450.00
2010 2011 2012 2013 2014 2015
Comparison of 5 Year Cumulative Total Return
Ass umes Initial Inves tment of $100
December 2015
DISH Network Corp NASDAQ Composite-Total Returns Peer Group