Dish Network 2015 Annual Report Download - page 74
Download and view the complete annual report
Please find page 74 of the 2015 Dish Network annual report below. You can navigate through the pages in the report by either clicking on the pages listed below, or by using the keyword search tool below to find specific information within the annual report.-
 1
1 -
2
-
3
-
4
-
5
-
6
-
7
-
8
-
9
-
10
-
11
-
12
-
13
-
14
-
15
-
16
-
17
-
18
-
19
-
20
-
21
-
22
-
23
-
24
-
25
-
26
-
27
-
28
-
29
-
30
-
31
-
32
-
33
-
34
-
35
-
36
-
37
-
38
-
39
-
40
-
41
-
42
-
43
-
44
-
45
-
46
-
47
-
48
-
49
-
50
-
51
-
52
-
53
-
54
-
55
-
56
-
57
-
58
-
59
-
60
-
61
-
62
-
63
-
 64
64 -
 65
65 -
 66
66 -
 67
67 -
 68
68 -
 69
69 -
 70
70 -
 71
71 -
 72
72 -
 73
73 -
 74
74 -
 75
75 -
 76
76 -
 77
77 -
 78
78 -
 79
79 -
 80
80 -
 81
81 -
 82
82 -
 83
83 -
 84
84 -
85
-
86
-
87
-
88
-
89
-
90
-
91
-
92
-
93
-
94
-
95
-
96
-
97
-
98
-
99
-
100
-
101
-
102
-
103
-
104
-
105
-
106
-
107
-
108
-
109
-
110
-
111
-
112
-
113
-
114
-
115
-
116
-
117
-
118
-
119
-
120
-
121
-
122
-
123
-
124
-
125
-
126
-
127
-
128
-
129
-
130
-
131
-
132
-
133
-
134
-
135
-
136
-
137
-
138
-
139
-
140
-
141
-
142
-
143
-
144
-
145
-
146
-
147
-
148
-
149
-
150
-
151
-
152
-
153
-
154
-
155
-
156
-
157
-
158
-
159
-
160
-
161
-
162
-
163
-
164
-
165
-
166
-
167
-
168
-
169
-
170
-
171
-
172
-
173
-
174
-
175
-
176
-
177
-
178
-
179
-
180
-
181
-
182
-
183
-
184
-
185
-
186
-
187
-
188
 |
 |
64
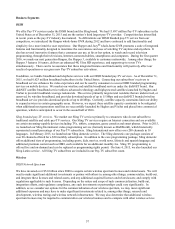
Pay-TV subscribers. We lost approximately 81,000 net Pay-TV subscribers during the year ended December 31, 2015,
compared to the loss of approximately 79,000 net Pay-TV subscribers during the same period in 2014. The increase in
net Pay-TV subscriber losses versus the same period in 2014 resulted from a higher Pay-TV churn rate discussed below,
partially offset by higher gross new Pay-TV subscriber activations, primarily related to the activation of Sling TV
subscribers, which are reported net of disconnects. Our Sling domestic service was launched in February 2015.
Our Pay-TV churn rate for the year ended December 31, 2015 was 1.71% compared to 1.59% for the same period in
2014. Our Pay-TV churn rate increased during the year ended December 31, 2015 as a result of increased competitive
pressures, including aggressive marketing, bundled discount offers combining broadband, video and/or wireless services
and other discounted promotional offers, as well as cord cutting. Our Pay-TV churn rate is also impacted by, among
other things, the credit quality of previously acquired subscribers, our ability to consistently provide outstanding
customer service, price increases, programming interruptions in connection with the scheduled expiration of certain
programming carriage contracts, our ability to control piracy and other forms of fraud and the level of our retention
efforts.
During the year ended December 31, 2015, we activated approximately 2.773 million gross new Pay-TV subscribers
compared to approximately 2.601 million gross new Pay-TV subscribers during the same period in 2014, an increase of
6.6%. The increase in our gross new Pay-TV subscriber activations primarily related to the activation of Sling TV
subscribers, which are reported net of disconnects, partially offset by stricter customer acquisition policies for our DISH
branded pay-TV subscribers (including a focus on attaining higher quality subscribers) and increased competitive
pressures, including aggressive marketing, more aggressive retention efforts, bundled discount offers combining
broadband, video and/or wireless services and other discounted promotional offers. Furthermore, our gross new Pay-TV
subscriber activations were negatively impacted by programming interruptions in connection with the scheduled
expiration of certain programming carriage contracts during the first half of the first quarter 2015.
Our gross new Pay-TV subscriber activations, net Pay-TV subscriber additions and Pay-TV churn rate have been
negatively impacted as a result of multiple programming interruptions and threatened programming interruptions in
connection with the scheduled expiration of programming carriage contracts with several content providers, including,
among others, Turner Networks, 21st Century Fox and certain local network affiliates. In particular, we suffered from
lower gross new Pay-TV subscriber activations, lower net Pay-TV subscriber additions and higher Pay-TV churn rate
beginning in the fourth quarter 2014 and continuing in the first quarter 2015, when, among others, certain programming
from 21st Century Fox, including Fox entertainment and news channels, was not available on our service. We cannot
predict with any certainty the impact to our gross new Pay-TV subscriber activations, net Pay-TV subscriber additions
and Pay-TV churn rate resulting from similar programming interruptions that may occur in the future. As a result, we
may at times suffer from periods of lower gross new Pay-TV subscriber activations, lower net Pay-TV subscriber
additions and higher Pay-TV churn rates as we did beginning in the fourth quarter 2014 and continuing in the first
quarter 2015.
We have not always met our own standards for performing high-quality installations, effectively resolving subscriber
issues when they arise, answering subscriber calls in an acceptable timeframe, effectively communicating with our
subscriber base, reducing calls driven by the complexity of our business, improving the reliability of certain systems and
subscriber equipment, and aligning the interests of certain independent third-party retailers and installers to provide high-
quality service. Most of these factors have affected both gross new Pay-TV subscriber activations as well as Pay-TV
churn rate. Our future gross new Pay-TV subscriber activations and our Pay-TV churn rate may be negatively impacted
by these factors, which could in turn adversely affect our revenue growth.
Broadband subscribers. We added approximately 46,000 net Broadband subscribers during the year ended
December 31, 2015 compared to the addition of approximately 141,000 net Broadband subscribers during the same
period in 2014. This decrease in net Broadband subscriber additions versus the same period in 2014 resulted from lower
gross new Broadband subscriber activations and a higher number of customer disconnects. During the year ended
December 31, 2015 and 2014, we activated approximately 237,000 and 295,000 gross new Broadband subscribers,
respectively. Gross new Broadband subscriber activations declined primarily due to stricter customer acquisition