Dish Network 2015 Annual Report Download - page 81
Download and view the complete annual report
Please find page 81 of the 2015 Dish Network annual report below. You can navigate through the pages in the report by either clicking on the pages listed below, or by using the keyword search tool below to find specific information within the annual report.-
 1
1 -
2
-
3
-
4
-
5
-
6
-
7
-
8
-
9
-
10
-
11
-
12
-
13
-
14
-
15
-
16
-
17
-
18
-
19
-
20
-
21
-
22
-
23
-
24
-
25
-
26
-
27
-
28
-
29
-
30
-
31
-
32
-
33
-
34
-
35
-
36
-
37
-
38
-
39
-
40
-
41
-
42
-
43
-
44
-
45
-
46
-
47
-
48
-
49
-
50
-
51
-
52
-
53
-
54
-
55
-
56
-
57
-
58
-
59
-
60
-
61
-
62
-
63
-
64
-
65
-
66
-
67
-
68
-
69
-
70
-
 71
71 -
 72
72 -
 73
73 -
 74
74 -
 75
75 -
 76
76 -
 77
77 -
 78
78 -
 79
79 -
 80
80 -
 81
81 -
 82
82 -
 83
83 -
 84
84 -
 85
85 -
 86
86 -
 87
87 -
 88
88 -
 89
89 -
 90
90 -
 91
91 -
92
-
93
-
94
-
95
-
96
-
97
-
98
-
99
-
100
-
101
-
102
-
103
-
104
-
105
-
106
-
107
-
108
-
109
-
110
-
111
-
112
-
113
-
114
-
115
-
116
-
117
-
118
-
119
-
120
-
121
-
122
-
123
-
124
-
125
-
126
-
127
-
128
-
129
-
130
-
131
-
132
-
133
-
134
-
135
-
136
-
137
-
138
-
139
-
140
-
141
-
142
-
143
-
144
-
145
-
146
-
147
-
148
-
149
-
150
-
151
-
152
-
153
-
154
-
155
-
156
-
157
-
158
-
159
-
160
-
161
-
162
-
163
-
164
-
165
-
166
-
167
-
168
-
169
-
170
-
171
-
172
-
173
-
174
-
175
-
176
-
177
-
178
-
179
-
180
-
181
-
182
-
183
-
184
-
185
-
186
-
187
-
188
 |
 |

71
Interest expense, net of amounts capitalized. “Interest expense, net of amounts capitalized” totaled $611 million during
the year ended December 31, 2014, a decrease of $134 million or 18.0% compared to the same period in 2013. This
decrease was primarily related to an increase in capitalized interest principally associated with our wireless spectrum.
The decrease was also driven by a reduction in interest expense as a result of redemptions and repurchases of debt during
2013 and 2014, partially offset by the issuance of debt in November 2014.
Other, net. “Other, net” expense was $69 million during the year ended December 31, 2014, compared to income of
$385 million for the same period in 2013. The year ended December 31, 2014 was negatively impacted primarily by
unrealized losses on our derivative financial instruments. The year ended December 31, 2013 was positively impacted by
net realized and/or unrealized gains on our marketable investment securities and derivative financial instruments.
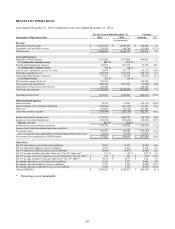
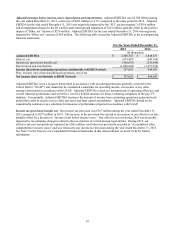
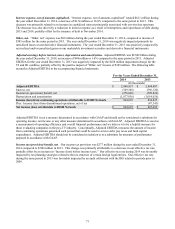
Adjusted earnings before interest, taxes, depreciation and amortization. Adjusted EBITDA was $2.849 billion during
the year ended December 31, 2014, an increase of $44 million or 1.6% compared to the same period in 2013. Adjusted
EBITDA for the year ended December 31, 2013 was negatively impacted by the $438 million impairment charge for the
T2 and D1 satellites, partially offset by the positive impact of “Other, net” income of $385 million. The following table
reconciles Adjusted EBITDA to the accompanying financial statements.
For the Years Ended December 31,
2014 2013
(In thousands)
Adjusted EBITDA $ 2,848,837 $ 2,804,807
Interest, net (549,368)
(596,120)
Income tax (provision) benefit, net (276,840)
(299,826)
Depreciation and amortization (1,077,936)
(1,054,026)
Income (loss) from continuing operations attributable to DISH Network 944,693 854,835
Plus: Income (loss) from discontinued operations, net of tax — (47,343)
Net income (loss) attributable to DISH Network $ 944,693 $ 807,492
Adjusted EBITDA is not a measure determined in accordance with GAAP and should not be considered a substitute for
operating income, net income or any other measure determined in accordance with GAAP. Adjusted EBITDA is used as
a measurement of operating efficiency and overall financial performance and we believe it to be a helpful measure for
those evaluating companies in the pay-TV industry. Conceptually, Adjusted EBITDA measures the amount of income
from continuing operations generated each period that could be used to service debt, pay taxes and fund capital
expenditures. Adjusted EBITDA should not be considered in isolation or as a substitute for measures of performance
prepared in accordance with GAAP.
Income tax (provision) benefit, net. Our income tax provision was $277 million during the year ended December 31,
2014 compared to $300 million in 2013. This change was primarily attributable to a decrease in our effective tax rate,
partially offset by an increase in “Income (loss) before income taxes.” Our effective tax rate during 2014 was favorably
impacted by tax planning strategies related to the tax structure of certain foreign legal entities. Our effective tax rate
during the same period in 2013 was favorably impacted by an audit settlement with the IRS related to periods prior to
2009.