Dish Network 2015 Annual Report Download - page 80
Download and view the complete annual report
Please find page 80 of the 2015 Dish Network annual report below. You can navigate through the pages in the report by either clicking on the pages listed below, or by using the keyword search tool below to find specific information within the annual report.-
 1
1 -
2
-
3
-
4
-
5
-
6
-
7
-
8
-
9
-
10
-
11
-
12
-
13
-
14
-
15
-
16
-
17
-
18
-
19
-
20
-
21
-
22
-
23
-
24
-
25
-
26
-
27
-
28
-
29
-
30
-
31
-
32
-
33
-
34
-
35
-
36
-
37
-
38
-
39
-
40
-
41
-
42
-
43
-
44
-
45
-
46
-
47
-
48
-
49
-
50
-
51
-
52
-
53
-
54
-
55
-
56
-
57
-
58
-
59
-
60
-
61
-
62
-
63
-
64
-
65
-
66
-
67
-
68
-
69
-
 70
70 -
 71
71 -
 72
72 -
 73
73 -
 74
74 -
 75
75 -
 76
76 -
 77
77 -
 78
78 -
 79
79 -
 80
80 -
 81
81 -
 82
82 -
 83
83 -
 84
84 -
 85
85 -
 86
86 -
 87
87 -
 88
88 -
 89
89 -
 90
90 -
91
-
92
-
93
-
94
-
95
-
96
-
97
-
98
-
99
-
100
-
101
-
102
-
103
-
104
-
105
-
106
-
107
-
108
-
109
-
110
-
111
-
112
-
113
-
114
-
115
-
116
-
117
-
118
-
119
-
120
-
121
-
122
-
123
-
124
-
125
-
126
-
127
-
128
-
129
-
130
-
131
-
132
-
133
-
134
-
135
-
136
-
137
-
138
-
139
-
140
-
141
-
142
-
143
-
144
-
145
-
146
-
147
-
148
-
149
-
150
-
151
-
152
-
153
-
154
-
155
-
156
-
157
-
158
-
159
-
160
-
161
-
162
-
163
-
164
-
165
-
166
-
167
-
168
-
169
-
170
-
171
-
172
-
173
-
174
-
175
-
176
-
177
-
178
-
179
-
180
-
181
-
182
-
183
-
184
-
185
-
186
-
187
-
188
 |
 |
70
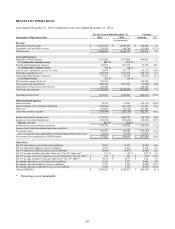
Pay-TV ARPU. Pay-TV ARPU was $83.77 during the year ended December 31, 2014 versus $80.37 during the same
period in 2013. The $3.40 or 4.2% increase in Pay-TV ARPU was primarily attributable to the programming package
price increases in February 2014 and 2013 and higher hardware related revenue, partially offset by a shift in
programming package mix.
Subscriber-related expenses. “Subscriber-related expenses” totaled $8.313 billion during the year ended December 31,
2014, an increase of $495 million or 6.3% compared to the same period in 2013. The increase in “Subscriber-related
expenses” was primarily attributable to higher pay-TV programming costs and higher Broadband subscriber-related
expenses due to the increase in our Broadband subscriber base, partially offset by a one-time reduction in programming
related expense. The increase in programming costs was driven by rate increases in certain of our programming
contracts, including the renewal of certain contracts at higher rates. Included in “Subscriber-related expenses” was $242
million and $143 million of expense related to our broadband services for the years ended December 31, 2014 and 2013,
respectively. “Subscriber-related expenses” represented 57.4% and 56.8% of “Subscriber-related revenue” during the
years ended December 31, 2014 and 2013, respectively. The change in this expense to revenue ratio primarily resulted
from higher pay-TV programming costs, discussed above.
Satellite and transmission expenses. “Satellite and transmission expenses” totaled $693 million during the year ended
December 31, 2014, an increase of $158 million or 29.4% compared to the same period in 2013. The increase in
“Satellite and transmission expenses” was primarily related to an increase in transponder capacity leased from EchoStar
as a result of the Satellite and Tracking Stock Transaction during the first quarter 2014. See Note 19 in the Notes to our
Consolidated Financial Statements in this Annual Report on Form 10-K for further information.
Subscriber acquisition costs. “Subscriber acquisition costs” totaled $1.811 billion for the year ended December 31,
2014, a decrease of $32 million or 1.7% compared to the same period in 2013. This change was primarily attributable to
a decrease in gross new Pay-TV subscriber activations and a decrease in expense related to our Broadband subscriber
activations. Included in “Subscriber acquisition costs” was $136 million and $154 million of expenses related to our
broadband services for the years ended December 31, 2014 and 2013, respectively.
Pay-TV SAC. Pay-TV SAC was $853 during the year ended December 31, 2014 compared to $866 during the same
period in 2013, a decrease of $13 or 1.5%. This change was primarily attributable to a decrease in hardware costs per
activation, partially offset by an increase in advertising costs. The decrease in hardware costs per activation was driven
by a reduction in manufacturing costs for next generation Hopper receiver systems and a higher percentage of
remanufactured receivers being activated on new subscriber accounts.
During the years ended December 31, 2014 and 2013, the amount of equipment capitalized under our lease program for
new Pay-TV subscribers totaled $543 million and $621 million, respectively. This decrease in capital expenditures
under our lease program for new Pay-TV subscribers primarily resulted from a decrease in hardware costs per activation
as discussed above and a decrease in gross new Pay-TV subscriber activations.
Depreciation and amortization. “Depreciation and amortization” expense totaled $1.078 billion during the year ended
December 31, 2014, a $24 million or 2.3% increase compared to the same period in 2013. During the year ended
December 31, 2014, we incurred higher depreciation expense from equipment leased primarily to new and existing
subscribers with new Hopper receiver systems, partially offset by a decrease in depreciation expense related to certain
satellites transferred to EchoStar as part of the Satellite and Tracking Stock Transaction. The year ended December 31,
2013 was negatively impacted by $53 million of additional depreciation expense as a result of the accelerated
depreciable lives of certain assets designed to support the TerreStar MSS business.
Impairment of long-lived assets. “Impairment of long-lived assets” of $438 million during the year ended December 31,
2013 resulted from an impairment of the T2 and D1 satellites. See Note 8 in the Notes to our Consolidated Financial
Statements in this Annual Report on Form 10-K for further information.
Interest income. “Interest income” totaled $62 million during the year ended December 31, 2014, a decrease of $87
million or 58.5% compared to the same period in 2013. This decrease principally resulted from lower percentage returns
earned on our cash and marketable investment securities during 2014.