Dish Network 2015 Annual Report Download - page 172
Download and view the complete annual report
Please find page 172 of the 2015 Dish Network annual report below. You can navigate through the pages in the report by either clicking on the pages listed below, or by using the keyword search tool below to find specific information within the annual report.-
 1
1 -
2
-
3
-
4
-
5
-
6
-
7
-
8
-
9
-
10
-
11
-
12
-
13
-
14
-
15
-
16
-
17
-
18
-
19
-
20
-
21
-
22
-
23
-
24
-
25
-
26
-
27
-
28
-
29
-
30
-
31
-
32
-
33
-
34
-
35
-
36
-
37
-
38
-
39
-
40
-
41
-
42
-
43
-
44
-
45
-
46
-
47
-
48
-
49
-
50
-
51
-
52
-
53
-
54
-
55
-
56
-
57
-
58
-
59
-
60
-
61
-
62
-
63
-
64
-
65
-
66
-
67
-
68
-
69
-
70
-
71
-
72
-
73
-
74
-
75
-
76
-
77
-
78
-
79
-
80
-
81
-
82
-
83
-
84
-
85
-
86
-
87
-
88
-
89
-
90
-
91
-
92
-
93
-
94
-
95
-
96
-
97
-
98
-
99
-
100
-
101
-
102
-
103
-
104
-
105
-
106
-
107
-
108
-
109
-
110
-
111
-
112
-
113
-
114
-
115
-
116
-
117
-
118
-
119
-
120
-
121
-
122
-
123
-
124
-
125
-
126
-
127
-
128
-
129
-
130
-
131
-
132
-
133
-
134
-
135
-
136
-
137
-
138
-
139
-
140
-
141
-
142
-
143
-
144
-
145
-
146
-
147
-
148
-
149
-
150
-
151
-
152
-
153
-
154
-
155
-
156
-
157
-
158
-
159
-
160
-
161
-
 162
162 -
 163
163 -
 164
164 -
 165
165 -
 166
166 -
 167
167 -
 168
168 -
 169
169 -
 170
170 -
 171
171 -
 172
172 -
 173
173 -
 174
174 -
 175
175 -
 176
176 -
 177
177 -
 178
178 -
 179
179 -
 180
180 -
 181
181 -
 182
182 -
183
-
184
-
185
-
186
-
187
-
188
 |
 |

DISH NETWORK CORPORATION
NOTES TO CONSOLIDATED FINANCIAL STATEMENTS - Continued
F-68
All
Other & Consolidated
DISH Wireless Eliminations Total
(In thousands)
Year Ended December 31, 2015
Total revenue $ 15,068,505 $ 396 $ — $ 15,068,901
Depreciation and amortization 955,749 44,299 — 1,000,048
Operating income (loss) 2,037,971 (705,575) — 1,332,396
Interest income 859,605 9,434 (849,516) 19,523
Interest expense, net of amounts capitalized (844,249) (499,277) 849,516 (494,010)
Other, net 82,160 195,883 — 278,043
Income tax (provision) benefit, net (759,148) 392,472 — (366,676)
Income (loss) from continuing operations 1,376,339 (607,063) — 769,276
Year Ended December 31, 2014
Total revenue $ 14,643,049 $ 410 $ (72) $ 14,643,387
Depreciation and amortization 1,006,082 71,854 — 1,077,936
Operating income (loss) 1,922,363 (97,912) — 1,824,451
Interest income 376,422 15,384 (329,965) 61,841
Interest expense, net of amounts capitalized (821,766) (119,408) 329,965 (611,209)
Other, net (9,414) (59,927) — (69,341)
Income tax (provision) benefit, net (436,753) 159,913 — (276,840)
Income (loss) from continuing operations 1,030,851 (101,949) — 928,902
Year Ended December 31, 2013
Total revenue $ 13,903,091 $ 1,774 $ — $ 13,904,865
Depreciation and amortization 952,793 101,233 — 1,054,026
Operating income (loss) 1,938,998 (590,819) — 1,348,179
Interest income 197,095 99,953 (148,183) 148,865
Interest expense, net of amounts capitalized (742,207) (150,961) 148,183 (744,985)
Other, net 42,719 342,137 — 384,856
Income tax (provision) benefit, net (511,491) 211,665 — (299,826)
Income (loss) from continuing operations 925,114 (88,025) — 837,089
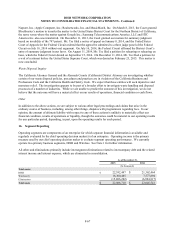
(1) This increase in assets is primarily related to our non-controlling investments in the Northstar Entities and the
SNR Entities related to the AWS-3 Licenses. See Note 15 for further information.
Geographic Information. Revenues are attributed to geographic regions based upon the location where the
products are delivered and services are provided. All revenue from continuing operations was derived from the
United States.
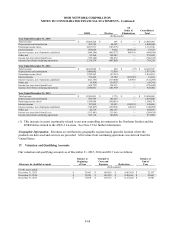
17. Valuation and Qualifying Accounts
Our valuation and qualifying accounts as of December 31, 2015, 2014 and 2013 were as follows:
Allowance for doubtful accounts
Balance at
Beginning
of Year
Charged to
Costs and
Expenses Deductions
Balance at
End of
Year
(In thousands)
For the years ended:
December 31, 2015 $ 23,603 $ 104,926 $ (106,362)
$ 22,167
December 31, 2014 $ 15,981 $ 156,318 $ (148,696)
$ 23,603
December 31, 2013 $ 13,834 $ 129,372 $ (127,225)
$ 15,981