Dish Network 2015 Annual Report Download - page 149
Download and view the complete annual report
Please find page 149 of the 2015 Dish Network annual report below. You can navigate through the pages in the report by either clicking on the pages listed below, or by using the keyword search tool below to find specific information within the annual report.-
 1
1 -
2
-
3
-
4
-
5
-
6
-
7
-
8
-
9
-
10
-
11
-
12
-
13
-
14
-
15
-
16
-
17
-
18
-
19
-
20
-
21
-
22
-
23
-
24
-
25
-
26
-
27
-
28
-
29
-
30
-
31
-
32
-
33
-
34
-
35
-
36
-
37
-
38
-
39
-
40
-
41
-
42
-
43
-
44
-
45
-
46
-
47
-
48
-
49
-
50
-
51
-
52
-
53
-
54
-
55
-
56
-
57
-
58
-
59
-
60
-
61
-
62
-
63
-
64
-
65
-
66
-
67
-
68
-
69
-
70
-
71
-
72
-
73
-
74
-
75
-
76
-
77
-
78
-
79
-
80
-
81
-
82
-
83
-
84
-
85
-
86
-
87
-
88
-
89
-
90
-
91
-
92
-
93
-
94
-
95
-
96
-
97
-
98
-
99
-
100
-
101
-
102
-
103
-
104
-
105
-
106
-
107
-
108
-
109
-
110
-
111
-
112
-
113
-
114
-
115
-
116
-
117
-
118
-
119
-
120
-
121
-
122
-
123
-
124
-
125
-
126
-
127
-
128
-
129
-
130
-
131
-
132
-
133
-
134
-
135
-
136
-
137
-
138
-
 139
139 -
 140
140 -
 141
141 -
 142
142 -
 143
143 -
 144
144 -
 145
145 -
 146
146 -
 147
147 -
 148
148 -
 149
149 -
 150
150 -
 151
151 -
 152
152 -
 153
153 -
 154
154 -
 155
155 -
 156
156 -
 157
157 -
 158
158 -
 159
159 -
160
-
161
-
162
-
163
-
164
-
165
-
166
-
167
-
168
-
169
-
170
-
171
-
172
-
173
-
174
-
175
-
176
-
177
-
178
-
179
-
180
-
181
-
182
-
183
-
184
-
185
-
186
-
187
-
188
 |
 |

DISH NETWORK CORPORATION
NOTES TO CONSOLIDATED FINANCIAL STATEMENTS - Continued
F-45
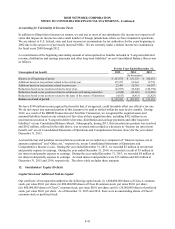
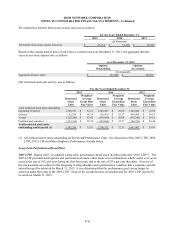
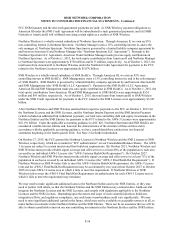
We realized tax benefits from stock awards exercised as follows:
For the Years Ended December 31,
2015 2014 2013
(In thousands)
Tax benefit from stock awards exercised $ 33,716 $ 52,366 $ 38,947
Based on the closing market price of our Class A common stock on December 31, 2015, the aggregate intrinsic
value of our stock options was as follows:
As of December 31, 2015
Options
Outstanding
Options
Exercisable
(In thousands)
Aggregate intrinsic value $ 187,409 $ 60,660
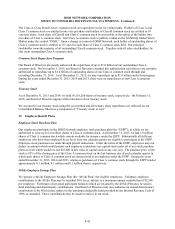
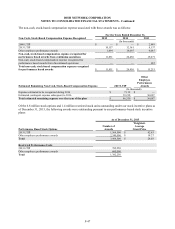
Our restricted stock unit activity was as follows:
For the Years Ended December 31,
2015 2014 2013
Restricted
Stock
Units
Weighted-
Average
Grant Date
Fair Value
Restricted
Stock
Units
Weighted-
Average
Grant Date
Fair Value
Restricted
Stock
Units
Weighted-
Average
Grant Date
Fair Value
Total restricted stock units outstanding,
beginning of period 1,798,331 $ 32.31 1,943,497 $ 29.09 1,185,080 $ 22.99
Granted 62,530 $ 68.79 316,500 $ 63.57 990,000 $ 36.53
Vested (125,280) $ 63.92 (278,000) $ 45.04 (135,250) $ 29.19
Forfeited and cancelled (353,331) $ 28.76 (183,666) $ 32.77 (96,333) $ 30.46
Total restricted stock units
outstanding, end of period (1) 1,382,250 $ 32.01 1,798,331 $ 32.31 1,943,497 $ 29.09
(1) All restricted stock units outstanding are Restricted Performance Units. See discussion of the 2005 LTIP, 2008
LTIP, 2013 LTIP and Other Employee Performance Awards below.
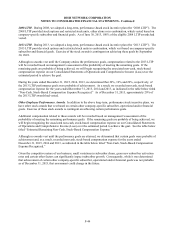
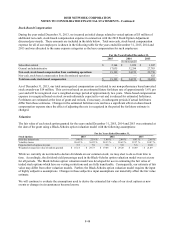
Long-Term Performance-Based Plans
2005 LTIP. During 2005, we adopted a long-term, performance-based stock incentive plan (the “2005 LTIP”). The
2005 LTIP provided stock options and restricted stock units, either alone or in combination, which vested over seven
years at the rate of 10% per year during the first four years, and at the rate of 20% per year thereafter. Exercise of
the stock awards was subject to the foregoing vesting schedule and a performance condition that a company-specific
subscriber goal be achieved by March 31, 2015. It was determined that the performance goal can no longer be
achieved under the terms of the 2005 LTIP. None of the awards became exercisable and the 2005 LTIP expired by
its terms on March 31, 2015.