Dish Network 2015 Annual Report Download - page 111
Download and view the complete annual report
Please find page 111 of the 2015 Dish Network annual report below. You can navigate through the pages in the report by either clicking on the pages listed below, or by using the keyword search tool below to find specific information within the annual report.-
 1
1 -
2
-
3
-
4
-
5
-
6
-
7
-
8
-
9
-
10
-
11
-
12
-
13
-
14
-
15
-
16
-
17
-
18
-
19
-
20
-
21
-
22
-
23
-
24
-
25
-
26
-
27
-
28
-
29
-
30
-
31
-
32
-
33
-
34
-
35
-
36
-
37
-
38
-
39
-
40
-
41
-
42
-
43
-
44
-
45
-
46
-
47
-
48
-
49
-
50
-
51
-
52
-
53
-
54
-
55
-
56
-
57
-
58
-
59
-
60
-
61
-
62
-
63
-
64
-
65
-
66
-
67
-
68
-
69
-
70
-
71
-
72
-
73
-
74
-
75
-
76
-
77
-
78
-
79
-
80
-
81
-
82
-
83
-
84
-
85
-
86
-
87
-
88
-
89
-
90
-
91
-
92
-
93
-
94
-
95
-
96
-
97
-
98
-
99
-
100
-
 101
101 -
 102
102 -
 103
103 -
 104
104 -
 105
105 -
 106
106 -
 107
107 -
 108
108 -
 109
109 -
 110
110 -
 111
111 -
 112
112 -
 113
113 -
 114
114 -
 115
115 -
 116
116 -
 117
117 -
 118
118 -
 119
119 -
 120
120 -
 121
121 -
122
-
123
-
124
-
125
-
126
-
127
-
128
-
129
-
130
-
131
-
132
-
133
-
134
-
135
-
136
-
137
-
138
-
139
-
140
-
141
-
142
-
143
-
144
-
145
-
146
-
147
-
148
-
149
-
150
-
151
-
152
-
153
-
154
-
155
-
156
-
157
-
158
-
159
-
160
-
161
-
162
-
163
-
164
-
165
-
166
-
167
-
168
-
169
-
170
-
171
-
172
-
173
-
174
-
175
-
176
-
177
-
178
-
179
-
180
-
181
-
182
-
183
-
184
-
185
-
186
-
187
-
188
 |
 |

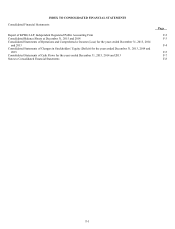
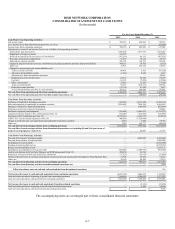
F-7
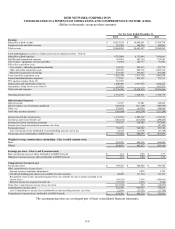
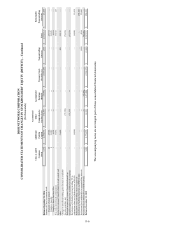
DISH NETWORK CORPORATION
CONSOLIDATED STATEMENTS OF CASH FLOWS
(In thousands)
For the Years Ended December 31,
2015 2014 2013
Cash Flows From Operating Activities:
N
et income (loss) $ 769,276 $ 928,902 $ 789,746
Less: Income (loss) from discontinued operations, net of tax — — (47,343)
Income (loss) from continuing operations $ 769,276 $ 928,902 $ 837,089
A
djustments to reconcile net income (loss) to net cash flows from operating activities:
Depreciation and amortization 1,000,048
1,077,936 1,054,026
Impairment of long-lived assets 123,352 — 437,575
Realized and unrealized losses (gains) on investments (287,250) 60,515 (387,675)
Non-cash, stock-based compensation 19,199 34,153 29,730
Deferred tax expense (benefit) 206,392
134,535 126,194
Change in long-term deferred revenue, distribution and carriage payments and other long-term liabilities 104,233 30,792 (2,352)
Other, net 18,323
106,752 68,339
Changes in current assets and current liabilities, net
Trade accounts receivable 88,901
6,305 (97,228)
Allowance for doubtful accounts (1,436) 8,649 2,147
Advances (to) from discontinued operations — — 48,803
Prepaid and accrued income taxes 64,775 85,586 26,397
Inventory 116,503
(5,090) (12,654)
Other current assets 15,632 (2,583) (71,324)
Trade accounts payable 56,633
(210,163) 109,052
Deferred revenue and other (21,714) 47,988 3,497
Accrued programming and other accrued expenses 163,213 103,854 137,581
Net cash flows from operating activities from continuing operations 2,436,080 2,408,131 2,309,197
Net cash flows from operating activities from discontinued operations, net — (30,007) (36,732)
Cash Flows From Investing Activities:
Purchases of marketable investment securities (447,901) (4,119,489) (6,356,136)
Sales and maturities of marketable investment securities 2,054,805 7,054,104 4,999,639
Purchases of derivative financial instruments — (149,969) (805,996)
Settlement of derivative financial instruments — — 718,847
Purchases of property and equipment (761,694) (1,001,861) (1,116,573)
Capitalized interest related to FCC authorizations (Note 15) (352,683) (214,000) (136,926)
Purchases of FCC authorizations (Note 15) (8,970,389) (1,343,372) (328,134)
AWS-3 FCC license refunds (deposits) (Note 15) 400,000 (1,320,000) —
Change in restricted cash, cash equivalents and marketable investment securities 4,610 7,886 38,782
Other, net (897) 102,777 (48,360)
Net cash flows from investing activities from continuing operations (8,074,149) (983,924) (3,034,857)
Net cash flows from investing activities from discontinued operations, net, including $0 and $0 of purchases of
property and equipment, respectively — 20,847 13,773
Cash Flows From Financing Activities:
Proceeds from issuance of long-term debt — 2,000,000 2,300,000
Proceeds from issuance of restricted debt — — 2,600,000
Redemption of restricted debt — — (2,600,000)
Funding of restricted debt escrow —
— (2,596,750)
Release of restricted debt escrow — — 2,596,771
Redemption and repurchases of long-term debt (650,001) (1,099,999) (500,000)
Capital contributions from Northstar Manager and SNR Management (Note 15) 204,200 20,700 —
Repayment of long-term debt and capital lease obligations (31,525) (31,653) (37,869)
N
et proceeds from Class A common stock options exercised and stock issued under the Employee Stock Purchase Plan 33,868 50,934 76,512
Other, net 30,189
40,285 13,276
Net cash flows from financing activities from continuing operations (413,269) 980,267 1,851,940
Net cash flows from financing activities from discontinued operations, net — — (435)
Effect of exchange rates on cash and cash equivalents from discontinued operations — — 156
Net increase (decrease) in cash and cash equivalents from continuing operations (6,051,338) 2,404,474 1,126,280
Cash and cash equivalents, beginning of period from continuing operations 7,104,496 4,700,022 3,573,742
Cash and cash equivalents, end of period from continuing operations $ 1,053,158 $ 7,104,496 $ 4,700,022
Net increase (decrease) in cash and cash equivalents from discontinued operations — (9,160) (23,238)
Cash and cash equivalents, beginning of period from discontinued operations — 9,160 32,398
Cash and cash equivalents, end of period from discontinued operations $ — $ — $ 9,160
The accompanying notes are an integral part of these consolidated financial statements.