Dish Network 2015 Annual Report Download - page 75
Download and view the complete annual report
Please find page 75 of the 2015 Dish Network annual report below. You can navigate through the pages in the report by either clicking on the pages listed below, or by using the keyword search tool below to find specific information within the annual report.-
 1
1 -
2
-
3
-
4
-
5
-
6
-
7
-
8
-
9
-
10
-
11
-
12
-
13
-
14
-
15
-
16
-
17
-
18
-
19
-
20
-
21
-
22
-
23
-
24
-
25
-
26
-
27
-
28
-
29
-
30
-
31
-
32
-
33
-
34
-
35
-
36
-
37
-
38
-
39
-
40
-
41
-
42
-
43
-
44
-
45
-
46
-
47
-
48
-
49
-
50
-
51
-
52
-
53
-
54
-
55
-
56
-
57
-
58
-
59
-
60
-
61
-
62
-
63
-
64
-
 65
65 -
 66
66 -
 67
67 -
 68
68 -
 69
69 -
 70
70 -
 71
71 -
 72
72 -
 73
73 -
 74
74 -
 75
75 -
 76
76 -
 77
77 -
 78
78 -
 79
79 -
 80
80 -
 81
81 -
 82
82 -
 83
83 -
 84
84 -
 85
85 -
86
-
87
-
88
-
89
-
90
-
91
-
92
-
93
-
94
-
95
-
96
-
97
-
98
-
99
-
100
-
101
-
102
-
103
-
104
-
105
-
106
-
107
-
108
-
109
-
110
-
111
-
112
-
113
-
114
-
115
-
116
-
117
-
118
-
119
-
120
-
121
-
122
-
123
-
124
-
125
-
126
-
127
-
128
-
129
-
130
-
131
-
132
-
133
-
134
-
135
-
136
-
137
-
138
-
139
-
140
-
141
-
142
-
143
-
144
-
145
-
146
-
147
-
148
-
149
-
150
-
151
-
152
-
153
-
154
-
155
-
156
-
157
-
158
-
159
-
160
-
161
-
162
-
163
-
164
-
165
-
166
-
167
-
168
-
169
-
170
-
171
-
172
-
173
-
174
-
175
-
176
-
177
-
178
-
179
-
180
-
181
-
182
-
183
-
184
-
185
-
186
-
187
-
188
 |
 |
65
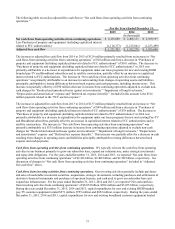
policies and satellite capacity constraints in certain geographic areas. Customer disconnects were higher primarily due to
a larger Broadband subscriber base during the year ended December 31, 2015 compared to the same period in 2014.
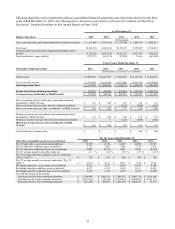
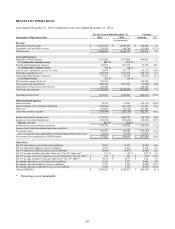
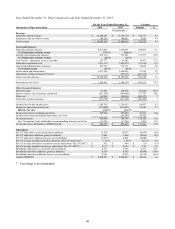
Subscriber-related revenue. “Subscriber-related revenue” totaled $14.954 billion for the year ended December 31,
2015, an increase of $458 million or 3.2% compared to the same period in 2014. The change in “Subscriber-related
revenue” from the same period in 2014 was primarily related to the increase in Pay-TV ARPU discussed below and
increased revenue from broadband services, partially offset by a lower average Pay-TV subscriber base. Included in
“Subscriber-related revenue” was $439 million and $376 million of revenue related to our broadband services for the
years ended December 31, 2015 and 2014, respectively, representing 2.9% and 2.6% of our total “Subscriber-related
revenue,” respectively.
Pay-TV ARPU. Pay-TV ARPU was $86.79 during the year ended December 31, 2015 versus $83.77 during the same
period in 2014. The $3.02 or 3.6% increase in Pay-TV ARPU was primarily attributable to the DISH branded pay-TV
programming package price increases in February 2015 and 2014 and higher hardware related revenue. These increases
were partially offset by a shift in DISH branded pay-TV programming package mix, an increase in retention credits and
an increase in Sling TV subscribers. Sling TV subscribers generally have lower priced programming packages than
DISH branded pay-TV subscribers. Accordingly, for the year ended December 31, 2015, the increase in Sling TV
subscribers had a negative impact on Pay-TV ARPU.
Subscriber-related expenses. “Subscriber-related expenses” totaled $8.783 billion during the year ended December 31,
2015, an increase of $470 million or 5.7% compared to the same period in 2014. The increase in “Subscriber-related
expenses” was primarily attributable to higher programming costs and higher Broadband subscriber-related expenses due
to the increase in our Broadband subscriber base, partially offset by a decrease in variable and retention costs per
subscriber and a lower average Pay-TV subscriber base. The increase in programming costs was driven by rate increases
in certain of our programming contracts, including the renewal of certain contracts at higher rates. Included in
“Subscriber-related expenses” was $272 million and $242 million of expense related to our broadband services for the
years ended December 31, 2015 and 2014, respectively. “Subscriber-related expenses” represented 58.7% and 57.4% of
“Subscriber-related revenue” during the years ended December 31, 2015 and 2014, respectively. The change in this
expense to revenue ratio primarily resulted from higher programming costs, discussed above.
In the normal course of business, we enter into contracts to purchase programming content in which our payment
obligations are generally contingent on the number of Pay-TV subscribers to whom we provide the respective content.
Our “Subscriber-related expenses” have and may continue to face further upward pressure from price increases and the
renewal of long-term programming contracts on less favorable pricing terms. In addition, our programming expenses
will continue to increase to the extent we are successful in growing our Pay-TV subscriber base.
Satellite and transmission expenses. “Satellite and transmission expenses” totaled $763 million during the year ended
December 31, 2015, an increase of $70 million or 10.1% compared to the same period in 2014. The increase in
“Satellite and transmission expenses” was primarily related to an increase in transmission costs associated with our Sling
TV services and an increase in uplink costs and in transponder capacity leased from EchoStar, related to our DISH
branded pay-TV service.
Subscriber acquisition costs. “Subscriber acquisition costs” totaled $1.683 billion for the year ended December 31,
2015, a decrease of $129 million or 7.1% compared to the same period in 2014. This change was primarily attributable
to a decrease in Pay-TV SAC, discussed below, and a decrease in expense related to our Broadband subscriber
activations. Included in “Subscriber acquisition costs” was $107 million and $136 million of expenses related to our
broadband services for the years ended December 31, 2015 and 2014, respectively.
Pay-TV SAC. Pay-TV SAC was $723 during the year ended December 31, 2015 compared to $853 during the same
period in 2014, a decrease of $130 or 15.2%. This change was primarily attributable to an increase in Sling TV
subscriber activations and a decrease in hardware costs per activation. The decrease in hardware costs per activation was
driven by a reduction in manufacturing costs for current generation Hopper receiver systems and a higher percentage of
remanufactured receivers being activated on new DISH branded pay-TV subscriber accounts.