Dish Network 2015 Annual Report Download - page 82
Download and view the complete annual report
Please find page 82 of the 2015 Dish Network annual report below. You can navigate through the pages in the report by either clicking on the pages listed below, or by using the keyword search tool below to find specific information within the annual report.-
 1
1 -
2
-
3
-
4
-
5
-
6
-
7
-
8
-
9
-
10
-
11
-
12
-
13
-
14
-
15
-
16
-
17
-
18
-
19
-
20
-
21
-
22
-
23
-
24
-
25
-
26
-
27
-
28
-
29
-
30
-
31
-
32
-
33
-
34
-
35
-
36
-
37
-
38
-
39
-
40
-
41
-
42
-
43
-
44
-
45
-
46
-
47
-
48
-
49
-
50
-
51
-
52
-
53
-
54
-
55
-
56
-
57
-
58
-
59
-
60
-
61
-
62
-
63
-
64
-
65
-
66
-
67
-
68
-
69
-
70
-
71
-
 72
72 -
 73
73 -
 74
74 -
 75
75 -
 76
76 -
 77
77 -
 78
78 -
 79
79 -
 80
80 -
 81
81 -
 82
82 -
 83
83 -
 84
84 -
 85
85 -
 86
86 -
 87
87 -
 88
88 -
 89
89 -
 90
90 -
 91
91 -
 92
92 -
93
-
94
-
95
-
96
-
97
-
98
-
99
-
100
-
101
-
102
-
103
-
104
-
105
-
106
-
107
-
108
-
109
-
110
-
111
-
112
-
113
-
114
-
115
-
116
-
117
-
118
-
119
-
120
-
121
-
122
-
123
-
124
-
125
-
126
-
127
-
128
-
129
-
130
-
131
-
132
-
133
-
134
-
135
-
136
-
137
-
138
-
139
-
140
-
141
-
142
-
143
-
144
-
145
-
146
-
147
-
148
-
149
-
150
-
151
-
152
-
153
-
154
-
155
-
156
-
157
-
158
-
159
-
160
-
161
-
162
-
163
-
164
-
165
-
166
-
167
-
168
-
169
-
170
-
171
-
172
-
173
-
174
-
175
-
176
-
177
-
178
-
179
-
180
-
181
-
182
-
183
-
184
-
185
-
186
-
187
-
188
 |
 |
72
LIQUIDITY AND CAPITAL RESOURCES
Cash, Cash Equivalents and Current Marketable Investment Securities
We consider all liquid investments purchased within 90 days of their maturity to be cash equivalents. See Note 6 in the
Notes to our Consolidated Financial Statements in this Annual Report on Form 10-K for further information regarding
our marketable investment securities. As of December 31, 2015, our cash, cash equivalents and current marketable
investment securities totaled $1.611 billion compared to $9.236 billion as of December 31, 2014, a decrease of $7.625
billion. This decrease in cash, cash equivalents and current marketable investment securities primarily resulted from our
non-controlling investments in the Northstar Entities and the SNR Entities related to the AWS-3 Licenses of $8.970
billion, the redemption of our 7 3/4% Senior Notes due 2015 of $650 million, capital expenditures of $762 million and
capitalized interest related to FCC authorizations of $353 million, partially offset by cash generated from continuing
operations of $2.436 billion, a refund from the FCC of our $400 million upfront payment related to the AWS-3 Auction
and $204 million in aggregate capital contributions to Northstar Spectrum and SNR HoldCo from Northstar Manager
and SNR Management, respectively. See Note 15 “Commitments and Contingencies — Wireless” in the Notes to our
Consolidated Financial Statements in this Annual Report on Form 10-K for further information.
Debt Maturity
Our 7 3/4% Senior Notes with a remaining principal balance of $650 million were redeemed on June 1, 2015.
Our 7 1/8% Senior Notes with an aggregate principal balance of $1.5 billion were redeemed on February 1, 2016, using a
substantial portion of our available cash and investment securities on hand.
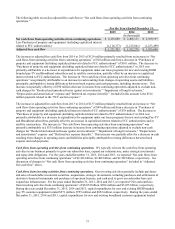
The following discussion highlights our cash flow activities during the years ended December 31, 2015, 2014 and 2013.
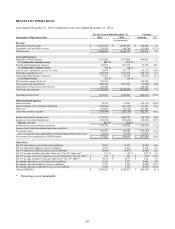
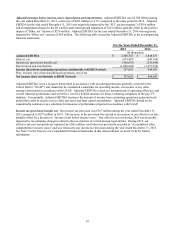
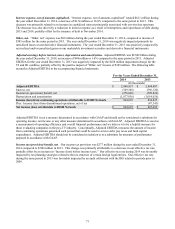
Adjusted Free Cash Flow
We define adjusted free cash flow as “Net cash flows from operating activities from continuing operations” less
“Purchases of property and equipment,” and “Capitalized interest related to FCC authorizations,” as shown on our
Consolidated Statements of Cash Flows. We believe adjusted free cash flow is an important liquidity metric because it
measures, during a given period, the amount of cash generated that is available to repay debt obligations, make
investments, fund acquisitions and for certain other activities. Adjusted free cash flow is not a measure determined in
accordance with GAAP and should not be considered a substitute for “Operating income,” “Net income,” “Net cash
flows from operating activities” or any other measure determined in accordance with GAAP. Since adjusted free cash
flow includes investments in operating assets, we believe this non-GAAP liquidity measure is useful in addition to the
most directly comparable GAAP measure “Net cash flows from operating activities from continuing operations.”
Adjusted free cash flow can be significantly impacted from period to period by changes in operating assets and liabilities
and in “Purchases of property and equipment” as shown in the “Net cash flows from operating activities from continuing
operations” and “Net cash flows from investing activities from continuing operations” sections, respectively, of our
Consolidated Statements of Cash Flows included herein. Operating asset and liability balances can fluctuate
significantly from period to period and there can be no assurance that adjusted free cash flow will not be negatively
impacted by material changes in operating assets and liabilities in future periods, since these changes depend upon,
among other things, management’s timing of payments and control of inventory levels, and cash receipts. In addition to
fluctuations resulting from changes in operating assets and liabilities, adjusted free cash flow can vary significantly from
period to period depending upon, among other things, subscriber growth, subscriber revenue, subscriber churn,
subscriber acquisition and retention costs including amounts capitalized under our equipment lease programs, operating
efficiencies, increases or decreases in purchases of property and equipment, commercialization of our wireless spectrum
and other factors.