Dish Network 2015 Annual Report Download - page 65
Download and view the complete annual report
Please find page 65 of the 2015 Dish Network annual report below. You can navigate through the pages in the report by either clicking on the pages listed below, or by using the keyword search tool below to find specific information within the annual report.-
 1
1 -
2
-
3
-
4
-
5
-
6
-
7
-
8
-
9
-
10
-
11
-
12
-
13
-
14
-
15
-
16
-
17
-
18
-
19
-
20
-
21
-
22
-
23
-
24
-
25
-
26
-
27
-
28
-
29
-
30
-
31
-
32
-
33
-
34
-
35
-
36
-
37
-
38
-
39
-
40
-
41
-
42
-
43
-
44
-
45
-
46
-
47
-
48
-
49
-
50
-
51
-
52
-
53
-
54
-
 55
55 -
 56
56 -
 57
57 -
 58
58 -
 59
59 -
 60
60 -
 61
61 -
 62
62 -
 63
63 -
 64
64 -
 65
65 -
 66
66 -
 67
67 -
 68
68 -
 69
69 -
 70
70 -
 71
71 -
 72
72 -
 73
73 -
 74
74 -
 75
75 -
76
-
77
-
78
-
79
-
80
-
81
-
82
-
83
-
84
-
85
-
86
-
87
-
88
-
89
-
90
-
91
-
92
-
93
-
94
-
95
-
96
-
97
-
98
-
99
-
100
-
101
-
102
-
103
-
104
-
105
-
106
-
107
-
108
-
109
-
110
-
111
-
112
-
113
-
114
-
115
-
116
-
117
-
118
-
119
-
120
-
121
-
122
-
123
-
124
-
125
-
126
-
127
-
128
-
129
-
130
-
131
-
132
-
133
-
134
-
135
-
136
-
137
-
138
-
139
-
140
-
141
-
142
-
143
-
144
-
145
-
146
-
147
-
148
-
149
-
150
-
151
-
152
-
153
-
154
-
155
-
156
-
157
-
158
-
159
-
160
-
161
-
162
-
163
-
164
-
165
-
166
-
167
-
168
-
169
-
170
-
171
-
172
-
173
-
174
-
175
-
176
-
177
-
178
-
179
-
180
-
181
-
182
-
183
-
184
-
185
-
186
-
187
-
188
 |
 |

55
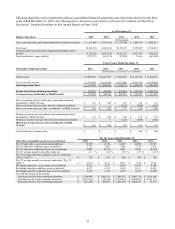
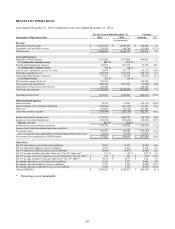
This data should be read in conjunction with our consolidated financial statements and related notes thereto for the three
years ended December 31, 2015, and “Management’s Discussion and Analysis of Financial Condition and Results of
Operations” included elsewhere in this Annual Report on Form 10-K.
As of December 31,
Balance Sheet Data
2015
2014
2013
2012
2011
(In thousands)
Cash, cash equivalents and current marketable investment securities $ 1,611,069 $ 9,236,241 $ 9,739,404 $ 7,205,379 $ 2,001,917
Total assets
22,886,710
22,045,541
20,192,117
17,229,902
11,346,073
Long-term debt and capital lease obligations (including current
p
ortion)
13,755,925
14,427,526
13,597,237
11,831,745 7,441,620
Total stockholders’ equity (deficit) 2,747,787 2,012,134 997,005 71,628 (419,003)
For the Years Ended December 31,
Statements of Operations Data
2015
2014
2013
2012
2011
(In thousands, except per share amounts)
Total revenue $
15,068,901 $
14,643,387 $
13,904,865 $
13,181,334 $
13,074,063
Total costs and expenses
13,736,505
12,818,936
12,556,686
11,922,976
10,145,080
Operating income (loss) $ 1,332,396 $ 1,824,451 $ 1,348,179 $ 1,258,358 $ 2,928,983
Income (loss) from continuing operations $ 769,276 $ 928,902 $ 837,089 $ 662,919 $ 1,522,374
Net income (loss) attributable to DISH Network $ 747,092 $ 944,693 $ 807,492 $ 636,687 $ 1,515,907
Basic net income (loss) per share from continuing operations
attributable to DISH Network $ 1.61 $ 2.05 $ 1.87 $ 1.49 $ 3.41
Basic net income (loss) per share from discontinued operations — — (0.10) (0.08) (0.01)
Basic net income (loss) per share attributable to DISH Network $ 1.61 $ 2.05 $ 1.77 $ 1.41 $ 3.40
Diluted net income (loss) per share from continuing operations
attributable to DISH Network $ 1.61 $ 2.04 $ 1.86 $ 1.49 $ 3.41
Diluted net income (loss) per share from discontinued operations — — (0.10) (0.08) (0.02)
Diluted net income (loss) per share attributable to DISH
Network $ 1.61 $ 2.04 $ 1.76 $ 1.41 $ 3.39
Cash dividend per common share $ — $ — $ — $ 1.00 $ 2.00
For the Years Ended December 31,
Other Data (Unaudited except for net cash flows) 2015 2014 2013 2012 2011
Pay-TV subscribers, as of period end (in millions) 13.897 13.978 14.057 14.056 13.967
Pay-TV subscriber additions, gross (in millions) 2.773 2.601 2.666 2.739 2.576
Pay-TV subscriber additions (losses), net (in millions) (0.081) (0.079) 0.001 0.089 (0.166)
Pay-TV average monthly subscriber churn rate 1.71 % 1.59 % 1.58 % 1.57 % 1.63 %
Pay-TV average subscriber acquisition cost per subscriber
(“Pay-TV SAC”) $ 723 $ 853 $ 866 $ 784 $ 770
Pay-TV average monthly revenue per subscriber (“Pay-TV
ARPU”) $ 86.79 $ 83.77 $ 80.37 $ 76.98 $ 76.43
Broadband subscribers, as of period end (in millions) 0.623 0.577 0.436 0.183 0.105
Broadband subscriber additions, gross (in millions) 0.237 0.295 0.343 0.121 0.030
Broadband subscriber additions (losses), net (in millions) 0.046 0.141 0.253 0.078 (0.005)
N
et cash flows from (in thousands):
Operating activities from continuing operations $ 2,436,080 $ 2,408,131 $ 2,309,197 $ 2,003,718 $ 2,619,160
Investing activities from continuing operations $ (8,074,149) $ (983,924) $ (3,034,857) $ (3,004,082) $ (2,783,172)
Financing activities from continuing operations $ (413,269) $ 980,267 $ 1,851,940 $ 4,003,933 $ 93,513