Dish Network 2015 Annual Report Download - page 78
Download and view the complete annual report
Please find page 78 of the 2015 Dish Network annual report below. You can navigate through the pages in the report by either clicking on the pages listed below, or by using the keyword search tool below to find specific information within the annual report.-
 1
1 -
2
-
3
-
4
-
5
-
6
-
7
-
8
-
9
-
10
-
11
-
12
-
13
-
14
-
15
-
16
-
17
-
18
-
19
-
20
-
21
-
22
-
23
-
24
-
25
-
26
-
27
-
28
-
29
-
30
-
31
-
32
-
33
-
34
-
35
-
36
-
37
-
38
-
39
-
40
-
41
-
42
-
43
-
44
-
45
-
46
-
47
-
48
-
49
-
50
-
51
-
52
-
53
-
54
-
55
-
56
-
57
-
58
-
59
-
60
-
61
-
62
-
63
-
64
-
65
-
66
-
67
-
 68
68 -
 69
69 -
 70
70 -
 71
71 -
 72
72 -
 73
73 -
 74
74 -
 75
75 -
 76
76 -
 77
77 -
 78
78 -
 79
79 -
 80
80 -
 81
81 -
 82
82 -
 83
83 -
 84
84 -
 85
85 -
 86
86 -
 87
87 -
 88
88 -
89
-
90
-
91
-
92
-
93
-
94
-
95
-
96
-
97
-
98
-
99
-
100
-
101
-
102
-
103
-
104
-
105
-
106
-
107
-
108
-
109
-
110
-
111
-
112
-
113
-
114
-
115
-
116
-
117
-
118
-
119
-
120
-
121
-
122
-
123
-
124
-
125
-
126
-
127
-
128
-
129
-
130
-
131
-
132
-
133
-
134
-
135
-
136
-
137
-
138
-
139
-
140
-
141
-
142
-
143
-
144
-
145
-
146
-
147
-
148
-
149
-
150
-
151
-
152
-
153
-
154
-
155
-
156
-
157
-
158
-
159
-
160
-
161
-
162
-
163
-
164
-
165
-
166
-
167
-
168
-
169
-
170
-
171
-
172
-
173
-
174
-
175
-
176
-
177
-
178
-
179
-
180
-
181
-
182
-
183
-
184
-
185
-
186
-
187
-
188
 |
 |

68
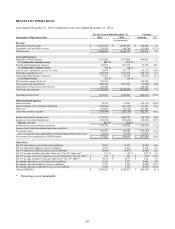
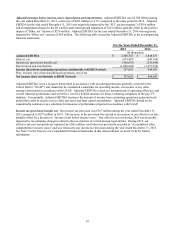
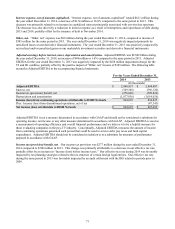
Year Ended December 31, 2014 Compared to the Year Ended December 31, 2013.
For the Years Ended December 31, Variance
Statements of Operations Data 2014 2013 Amount %
(In thousands)
Revenue:
Subscriber-related revenue $ 14,495,091 $ 13,764,774 $ 730,317 5.3
Equipment sales and other revenue 148,296 140,091 8,205 5.9
Total revenue 14,643,387 13,904,865 738,522 5.3
Costs and Expenses:
Subscriber-related expenses 8,313,046 7,818,061 494,985 6.3
% of Subscriber-related revenue 57.4 % 56.8 %
Satellite and transmission expenses 693,114 535,541 157,573 29.4
% of Subscriber-related revenue 4.8 % 3.9 %
Cost of sales - equipment, services and other 107,777 91,902 15,875 17.3
Subscriber acquisition costs 1,811,318 1,842,870 (31,552) (1.7)
General and administrative expenses 815,745 776,711 39,034 5.0
% of Total revenue 5.6 % 5.6 %
Depreciation and amortization 1,077,936 1,054,026 23,910 2.3
Impairment of long-lived assets (Note 8) — 437,575 (437,575) *
Total costs and expenses 12,818,936 12,556,686 262,250 2.1
Operating income (loss) 1,824,451 1,348,179 476,272 35.3
Other Income (Expense):
Interest income 61,841 148,865 (87,024) (58.5)
Interest expense, net of amounts capitalized (611,209) (744,985) 133,776 18.0
Other, net (69,341) 384,856 (454,197) *
Total other income (expense) (618,709) (211,264) (407,445) *
Income (loss) before income taxes 1,205,742 1,136,915 68,827 6.1
Income tax (provision) benefit, net (276,840) (299,826) 22,986 7.7
Effective tax rate 23.0 % 26.4 %
Income (loss) from continuing operations 928,902 837,089 91,813 11.0
Income (loss) from discontinued operations, net of tax — (47,343) 47,343 *
N
et income (loss) 928,902 789,746 139,156 17.6
Less: Net income (loss) attributable to noncontrolling interests, net of tax (15,791) (17,746) 1,955 11.0
N
et income (loss) attributable to DISH Network $ 944,693 $ 807,492 $ 137,201 17.0
Other Data:
Pay-TV subscribers, as of period end (in millions) 13.978 14.057 (0.079) (0.6)
Pay-TV subscriber additions, gross (in millions) 2.601 2.666 (0.065) (2.4)
Pay-TV subscriber additions (losses), net (in millions) (0.079) 0.001 (0.080) *
Pay-TV average monthly subscriber churn rate (“Pay-TV churn rate”) 1.59 % 1.58 % 0.01 % 0.6
Pay-TV average subscriber acquisition cost per subscriber (“Pay-TV SAC”) $ 853 $ 866 $ (13) (1.5)
Pay-TV average monthly revenue per subscriber (“Pay-TV ARPU”) $ 83.77 $ 80.37 $ 3.40 4.2
Broadband subscribers, as of period end (in millions) 0.577 0.436 0.141 32.3
Broadband subscriber additions, gross (in millions) 0.295 0.343 (0.048) (14.0)
Broadband subscriber additions (losses), net (in millions) 0.141 0.253 (0.112) (44.3)
Adjusted EBITDA $ 2,848,837 $ 2,804,807 $ 44,030 1.6
* Percentage is not meaningful.