CarMax 2015 Annual Report Download - page 78
Download and view the complete annual report
Please find page 78 of the 2015 CarMax annual report below. You can navigate through the pages in the report by either clicking on the pages listed below, or by using the keyword search tool below to find specific information within the annual report.-
 1
1 -
2
-
3
-
4
-
5
-
6
-
7
-
8
-
9
-
10
-
11
-
12
-
13
-
14
-
15
-
16
-
17
-
18
-
19
-
20
-
21
-
22
-
23
-
24
-
25
-
26
-
27
-
28
-
29
-
30
-
31
-
32
-
33
-
34
-
35
-
36
-
37
-
38
-
39
-
40
-
41
-
42
-
43
-
44
-
45
-
46
-
47
-
48
-
49
-
50
-
51
-
52
-
53
-
54
-
55
-
56
-
57
-
58
-
59
-
60
-
61
-
62
-
63
-
64
-
65
-
66
-
67
-
 68
68 -
 69
69 -
 70
70 -
 71
71 -
 72
72 -
 73
73 -
 74
74 -
 75
75 -
 76
76 -
 77
77 -
 78
78 -
 79
79 -
 80
80 -
 81
81 -
 82
82 -
 83
83 -
 84
84 -
 85
85 -
 86
86 -
 87
87 -
 88
88 -
89
-
90
-
91
-
92
 |
 |

74
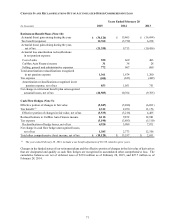
17. SELECTED QUARTERLY FINANCIAL DATA (UNAUDITED)
1st Quarter 2nd Quarter 3rd Quarter 4th Quarter Fiscal Year
(In thousands, except per share data) 2015 2015 2015 2015 (1) 2015
N
e
t
sales and operating revenues $ 3,750,196 $ 3,599,194 $ 3,405,234 $ 3,514,092 $ 14,268,716
Gross profit $ 501,731 $ 463,339 $ 446,620 $ 475,837 $ 1,887,527
CarMax Auto Finance income $ 94,615 $ 92,574 $ 89,722 $ 90,383 $ 367,294
Selling, general and administrative
expenses $ 313,446 $ 297,638 $ 316,632 $ 330,009 $ 1,257,725
N
et earnings $ 169,653 $ 154,518 $ 130,049 $ 143,138 $ 597,358
N
et earnings per share:
Basic $ 0.77 $ 0.71 $ 0.61 $ 0.68 $ 2.77
Diluted $ 0.76 $ 0.70 $ 0.60 $ 0.67 $ 2.73
1st Quarter 2nd Quarter 3rd Quarter 4th Quarter Fiscal Year
(In thousands, except per share data) 2014 2014 2014
2014 (2) 2014 (2)
N
et sales and operating revenues $ 3,311,057 $ 3,245,552 $ 2,941,407 $ 3,076,283 $ 12,574,299
Gross profit $ 448,096 $ 434,743 $ 381,721 $ 384,141 $ 1,648,701
CarMax Auto Finance income $ 87,019 $ 84,422 $ 83,905 $ 80,821 $ 336,167
Selling, general and administrative
expenses $ 290,189 $ 283,206 $ 284,366 $ 297,454 $ 1,155,215
N
et earnings $ 146,651 $ 140,274 $ 106,452 $ 99,209 $ 492,586
N
et earnings per share:
Basic $ 0.65 $ 0.63 $ 0.48 $ 0.45 $ 2.20
Diluted $ 0.64 $ 0.62 $ 0.47 $ 0.44 $ 2.16
(1) During the fourth quarter of fiscal 2015, we capitalized $8.9 million of interest expense, of which $6.9 million, or $0.02 per share, related
to earlier quarters in fiscal 2015.
(2) As disclosed in Note 8, during the fourth quarter of fiscal 2014, we corrected our accounting related to cancellation reserves for our ESP
and GAP products. The correction of the out of period error consisted of $0.02 per share pertaining to earlier quarters in fiscal 2014 and
$0.05 per share pertaining to fiscal 2013 and fiscal 2012.