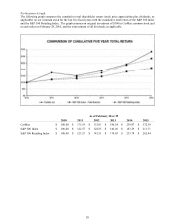
CarMax 2015 Annual Report Download - page 25
Download and view the complete annual report
Please find page 25 of the 2015 CarMax annual report below. You can navigate through the pages in the report by either clicking on the pages listed below, or by using the keyword search tool below to find specific information within the annual report.-
 1
1 -
2
-
3
-
4
-
5
-
6
-
7
-
8
-
9
-
10
-
11
-
12
-
13
-
14
-
 15
15 -
 16
16 -
 17
17 -
 18
18 -
 19
19 -
 20
20 -
 21
21 -
 22
22 -
 23
23 -
 24
24 -
 25
25 -
 26
26 -
 27
27 -
 28
28 -
 29
29 -
 30
30 -
 31
31 -
 32
32 -
 33
33 -
 34
34 -
 35
35 -
36
-
37
-
38
-
39
-
40
-
41
-
42
-
43
-
44
-
45
-
46
-
47
-
48
-
49
-
50
-
51
-
52
-
53
-
54
-
55
-
56
-
57
-
58
-
59
-
60
-
61
-
62
-
63
-
64
-
65
-
66
-
67
-
68
-
69
-
70
-
71
-
72
-
73
-
74
-
75
-
76
-
77
-
78
-
79
-
80
-
81
-
82
-
83
-
84
-
85
-
86
-
87
-
88
-
89
-
90
-
91
-
92
 |
 |
21
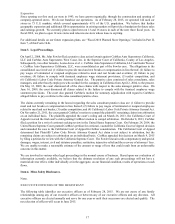
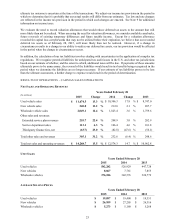
Item 6. Selected Financial Data.
(Dollars and shares in millions, except per share or per uni
t
data)
FY15 FY14 FY13 FY12
FY11
Income statement information
Used vehicle sales $ 11,674.5 $ 10,306.3 $ 8,747.0 $ 7,826.9 $ 7,210.0
Wholesale vehicle sales 2,049.1 1,823.4 1,759.6 1,721.6 1,301.7
Net sales and operating revenues 14,268.7 12,574.3 10,962.8 10,003.6 8,975.6
Gross profit 1,887.5 1,648.7 1,464.4 1,378.8 1,301.2
CarMax Auto Finance income 367.3 336.2 299.3 262.2 220.0
Selling, general and administrative expenses 1,257.7 1,155.2 1,031.0 940.8 878.8
Net earnings 597.4 492.6 434.3 413.8 377.5
Share and per share information
Weighted average diluted shares outstanding 218.7 227.6 231.8 230.7 227.6
Diluted net earnings per share $ 2.73 $ 2.16 $ 1.87 $ 1.79 $ 1.65
Balance sheet information
Auto loan receivables, net $ 8,435.5 $ 7,147.8 $ 5,895.9 $ 4,959.8 $ 4,320.6
Total assets 13,198.2 11,707.2 9,888.6 8,331.5 7,125.5
Total current liabilities 997.2 875.5 684.2 646.3 522.7
Total notes payable and other debt:
Non-recourse notes payable 8,470.6 7,248.4 5,855.1 4,684.1 4,013.6
Other 638.6 334.9 354.0 368.7 381.2
Unit sales information
Used vehicle units sold 582,282 526,929 447,728 408,080 396,181
Wholesale vehicle units sold 376,186 342,576 324,779 316,649 263,061
Per unit information
Used vehicle gross profit $ 2,179 $ 2,171 $ 2,170 $ 2,177 $ 2,156
Wholesale vehicle gross profit 970 916 949 953 908
SG&A per retail unit 2,128 2,161 2,263 2,263 2,173
Percent changes in
Comparable store used vehicle unit sales 4.4 % 12.2 % 5.4 % 1.3 % 9.8 %
Total used vehicle unit sales 10.5 17.7 9.7 3.0 10.9
Wholesale vehicle unit sales 9.8 5.5 2.6 20.4 33.3
Other year-end information
Used car stores 144 131 118 108 103
Associates 22,064 20,171 18,111 16,460 15,565