CarMax 2015 Annual Report Download - page 37
Download and view the complete annual report
Please find page 37 of the 2015 CarMax annual report below. You can navigate through the pages in the report by either clicking on the pages listed below, or by using the keyword search tool below to find specific information within the annual report.-
 1
1 -
2
-
3
-
4
-
5
-
6
-
7
-
8
-
9
-
10
-
11
-
12
-
13
-
14
-
15
-
16
-
17
-
18
-
19
-
20
-
21
-
22
-
23
-
24
-
25
-
26
-
 27
27 -
 28
28 -
 29
29 -
 30
30 -
 31
31 -
 32
32 -
 33
33 -
 34
34 -
 35
35 -
 36
36 -
 37
37 -
 38
38 -
 39
39 -
 40
40 -
 41
41 -
 42
42 -
 43
43 -
 44
44 -
 45
45 -
 46
46 -
 47
47 -
48
-
49
-
50
-
51
-
52
-
53
-
54
-
55
-
56
-
57
-
58
-
59
-
60
-
61
-
62
-
63
-
64
-
65
-
66
-
67
-
68
-
69
-
70
-
71
-
72
-
73
-
74
-
75
-
76
-
77
-
78
-
79
-
80
-
81
-
82
-
83
-
84
-
85
-
86
-
87
-
88
-
89
-
90
-
91
-
92
 |
 |

33
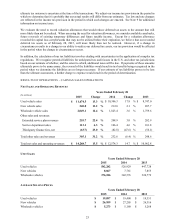
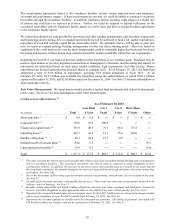
LOAN PERFORMANCE INFORMATION
Years Ended February 28
(In millions) 2015 2014 2013
N
et credit losses on managed receivables $ 70.5 $ 59.6 $ 42.2
Total average managed receivables $ 7,859.9 $ 6,629.5 $ 5,385.5
N
et credit losses as a percentage of total average
managed receivables 0.90 % 0.90 % 0.78 %
Total ending managed receivables $ 8,458.7 $ 7,184.4 $ 5,933.3
Past due accounts as a percentage of ending
managed receivables 2.62 % 2.58 % 2.60 %
Average recovery rate 54.2 % 55.2 % 58.4 %
The average recovery rate represents the average percentage of the outstanding principal balance we receive when a
vehicle is repossessed and liquidated, generally at our wholesale auctions. The annual recovery rate has ranged from
a low of 42% to a high of 60%, and it is primarily affected by changes in the wholesale market pricing environment.
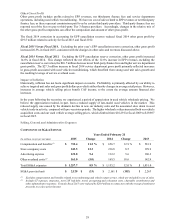
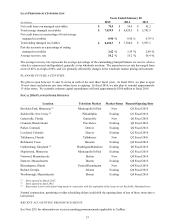
PLANNED FUTURE ACTIVITIES
We plan to open between 13 and 16 stores in each of the next three fiscal years. In fiscal 2016, we plan to open
14 new stores and relocate one store whose lease is expiring. In fiscal 2016, we also plan to remodel approximately
15 older stores. We currently estimate capital expenditures will total approximately $360 million in fiscal 2016.
FISCAL 2016 PLANNED STORE OPENINGS
Location Television Market Market Status Planned Opening Date
Brooklyn Park, Minnesota (1) Minneapolis/St Paul New Q1 Fiscal 2016
Sicklerville, New Jersey (2) Philadelphia Existing Q1 Fiscal 2016
Gainesville, Florida Gainesville New Q1 Fiscal 2016
Cranston, Rhode Island Providence Existing Q2 Fiscal 2016
Parker, Colorado Denver Existing Q2 Fiscal 2016
Loveland, Colorado Denver Existing Q2 Fiscal 2016
Tallahassee, Florida Tallahassee New Q2 Fiscal 2016
Richmond, Texas Houston Existing Q2 Fiscal 2016
Gaithersburg, Maryland (3) Washington/Baltimore Existing Q3 Fiscal 2016
Maplewood, Minnesota Minneapolis/St Paul Existing Q3 Fiscal 2016
N
orwood, Massachusetts Boston New Q4 Fiscal 2016
Danvers, Massachusetts Boston Existing Q4 Fiscal 2016
Bloomington, Illinois Peoria/Bloomington New Q4 Fiscal 2016
Buford, Georgia Atlanta Existing Q4 Fiscal 2016
Westborough, Massachusetts Boston Existing Q4 Fiscal 2016
(1) Store opened in March 2015.
(2) Store opened in April 2015.
(3) Represents a store relocation being made in connection with the expiration of the lease on our Rockville, Maryland store.
Normal construction, permitting or other scheduling delays could shift the opening dates of any of these stores into a
later period.
RECENT ACCOUNTING PRONOUNCEMENTS
See Note 2(Y) for information on recent accounting pronouncements applicable to CarMax.