CarMax 2015 Annual Report Download - page 73
Download and view the complete annual report
Please find page 73 of the 2015 CarMax annual report below. You can navigate through the pages in the report by either clicking on the pages listed below, or by using the keyword search tool below to find specific information within the annual report.-
 1
1 -
2
-
3
-
4
-
5
-
6
-
7
-
8
-
9
-
10
-
11
-
12
-
13
-
14
-
15
-
16
-
17
-
18
-
19
-
20
-
21
-
22
-
23
-
24
-
25
-
26
-
27
-
28
-
29
-
30
-
31
-
32
-
33
-
34
-
35
-
36
-
37
-
38
-
39
-
40
-
41
-
42
-
43
-
44
-
45
-
46
-
47
-
48
-
49
-
50
-
51
-
52
-
53
-
54
-
55
-
56
-
57
-
58
-
59
-
60
-
61
-
62
-
 63
63 -
 64
64 -
 65
65 -
 66
66 -
 67
67 -
 68
68 -
 69
69 -
 70
70 -
 71
71 -
 72
72 -
 73
73 -
 74
74 -
 75
75 -
 76
76 -
 77
77 -
 78
78 -
 79
79 -
 80
80 -
 81
81 -
 82
82 -
 83
83 -
84
-
85
-
86
-
87
-
88
-
89
-
90
-
91
-
92
 |
 |

69
STOCK-SETTLED RESTRICTED STOCK UNIT ACTIVITY
Weighted
Average
Number of Grant Date
(Units in thousands) Units
Fair Value
Outstanding as of February 28, 2014 852 $ 45.26
Stock units granted 250 $ 55.48
Stock units vested and converted (302) $ 45.69
Stock units cancelled (26) $ 48.10
Outstanding as of February 28, 2015 774 $ 48.30
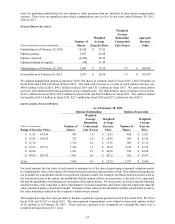
We granted 249,801 MSUs in fiscal 2015, 237,660 MSUs in fiscal 2014 and 348,551 MSUs in fiscal 2013. The
weighted average fair value per MSU at the date of grant was $55.48 in fiscal 2015, $52.02 in fiscal 2014 and $40.33
in fiscal 2013. The fair values were determined using a Monte-Carlo simulation and were based on the expected
market price of our common stock on the vesting date and the expected number of converted common shares. We
realized related tax benefits of $8.1 million during fiscal 2015, from the vesting of market stock units. The
unrecognized compensation costs related to nonvested MSUs totaled $13.5 million as of February 28, 2015. These
costs are expected to be recognized on a straight-line basis over a weighted average period of 1.0 years.
(E) Employee Stock Purchase Plan
We sponsor an employee stock purchase plan for all associates meeting certain eligibility criteria. Associate
contributions are limited to 10% of eligible compensation, up to a maximum of $7,500 per year. For each $1.00
contributed to the plan by associates, we match $0.15. We have authorized up to 8,000,000 shares of common stock
for the employee stock purchase plan. Shares are acquired through open-market purchases.
As of February 28, 2015, a total of 3,540,283 shares remained available under the plan. Shares purchased in the open
market on behalf of associates totaled 184,390 during fiscal 2015, 188,797 during fiscal 2014 and 251,667 during
fiscal 2013. The average price per share for purchases under the plan was $52.18 in fiscal 2015, $47.35 in fiscal 2014
and $32.05 in fiscal 2013. The total costs for matching contributions are included in share-based compensation
expense.
13. NET EARNINGS PER SHARE
BASIC AND DILUTIVE NET EARNINGS PER SHARE RECONCILIATIONS
Years Ended February 28
(In thousands except per share data) 2015 2014 2013
N
et earnings $ 597,358 $ 492,586 $ 434,284
Weighted average common shares outstanding 215,617 223,589 228,095
Dilutive potential common shares:
Stock options 2,369 3,255 3,161
Stock-settled restricted stock units 705 740 567
Weighted average common shares and dilutive
potential common shares 218,691 227,584 231,823
Basic net earnings per share $ 2.77
$ 2.20 $ 1.90
Diluted net earnings per share $ 2.73
$ 2.16 $ 1.87