CarMax 2015 Annual Report Download - page 32
Download and view the complete annual report
Please find page 32 of the 2015 CarMax annual report below. You can navigate through the pages in the report by either clicking on the pages listed below, or by using the keyword search tool below to find specific information within the annual report.-
 1
1 -
2
-
3
-
4
-
5
-
6
-
7
-
8
-
9
-
10
-
11
-
12
-
13
-
14
-
15
-
16
-
17
-
18
-
19
-
20
-
21
-
 22
22 -
 23
23 -
 24
24 -
 25
25 -
 26
26 -
 27
27 -
 28
28 -
 29
29 -
 30
30 -
 31
31 -
 32
32 -
 33
33 -
 34
34 -
 35
35 -
 36
36 -
 37
37 -
 38
38 -
 39
39 -
 40
40 -
 41
41 -
 42
42 -
43
-
44
-
45
-
46
-
47
-
48
-
49
-
50
-
51
-
52
-
53
-
54
-
55
-
56
-
57
-
58
-
59
-
60
-
61
-
62
-
63
-
64
-
65
-
66
-
67
-
68
-
69
-
70
-
71
-
72
-
73
-
74
-
75
-
76
-
77
-
78
-
79
-
80
-
81
-
82
-
83
-
84
-
85
-
86
-
87
-
88
-
89
-
90
-
91
-
92
 |
 |

28
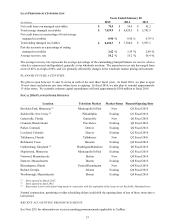
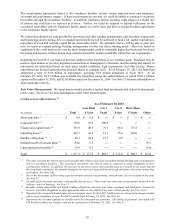
GROSS PROFIT
Years Ended February 28
(In millions) 2015 Change 2014 Change 2013
Used vehicle gross profit $ 1,268.5 10.9 % $ 1,143.9 17.7 % $ 971.5
N
ew vehicle gross profit 6.0 33.8 % 4.5 (9.5) % 5.0
Wholesale vehicle gross profit 364.9 16.3 % 313.9 1.9 % 308.1
Other gross profit 248.1 33.1 % 186.5 3.7 % 179.8
Total $ 1,887.5 14.5 % $ 1,648.7 12.6 % $ 1,464.4
GROSS PROFIT PER UNIT
Years Ended February 28
2015 2014 2013
$ per unit (1) %
(2) $ per unit
(1) %
(2) $ per unit
(1) %
(2)
Used vehicle gross profit $2,179 10.9
$ 2,171 11.1 $ 2,170 11.1
N
ew vehicle gross profit $676 2.5
$ 577 2.1 $ 630 2.4
Wholesale vehicle gross profit $970 17.8
$ 916 17.2 $ 949 17.5
Other gross profit $420 81.3
$ 349 80.2 $ 395 72.3
Total gross profit $3,193 13.2
$ 3,083 13.1 $ 3,214 13.4
(1) Calculated as category gross profit divided by its respective units sold, except the other and total categories, which are
divided by total retail units sold.
(2) Calculated as a percentage of its respective sales or revenue.
Used Vehicle Gross Profit
We target a dollar range of gross profit per used unit sold. The gross profit dollar target for an individual vehicle is
based on a variety of factors, including its anticipated probability of sale and its mileage relative to its age; however,
it is not primarily based on the vehicle’s selling price. Our ability to quickly adjust appraisal offers to be consistent
with the broader market trade-in trends and the pace of our inventory turns reduce our exposure to the inherent
continual fluctuation in used vehicle values and contribute to our ability to manage gross profit dollars per unit.
We systematically mark down individual vehicle prices based on proprietary pricing algorithms in order to
appropriately balance sales trends, inventory turns and gross profit achievement. Other factors that may influence
gross profit include changes in our vehicle reconditioning costs, changes in the percentage of vehicles sourced directly
from consumers through our appraisal process and changes in the wholesale pricing environment. Vehicles purchased
directly from consumers typically generate more gross profit per unit compared with vehicles purchased at auction or
through other channels.
Fiscal 2015 Versus Fiscal 2014. The 10.9% increase in used vehicle gross profit in fiscal 2015 was driven by the
corresponding increase in used unit sales. Used vehicle gross profit per unit remained consistent.
Fiscal 2014 Versus Fiscal 2013. The 17.7% increase in used vehicle gross profit in fiscal 2014 was driven by the
corresponding increase in used unit sales. Used vehicle gross profit per unit remained consistent.
Wholesale Vehicle Gross Profit
Our wholesale gross profit per unit reflects the demand for older, higher mileage vehicles, which are the mainstay of
our auctions, as well as the continued strong dealer attendance and resulting high dealer-to-car ratios at our auctions.
The frequency of our auctions, which are generally held weekly or bi-weekly, minimizes the depreciation risk on these
vehicles. Our ability to adjust appraisal offers in response to the wholesale pricing environment is a key factor that
influences wholesale gross profit.
Fiscal 2015 Versus Fiscal 2014. The 16.3% increase in wholesale vehicle gross profit in fiscal 2015 reflected the
combination of the 9.8% increase in wholesale unit sales with a 5.9% increase in wholesale gross profit per unit.
Fiscal 2014 Versus Fiscal 2013. The 1.9% increase in wholesale vehicle gross profit in fiscal 2014 reflected the 5.5%
increase in wholesale unit sales partially offset by a 3.5% reduction in wholesale gross profit per unit.