CarMax 2015 Annual Report Download - page 34
Download and view the complete annual report
Please find page 34 of the 2015 CarMax annual report below. You can navigate through the pages in the report by either clicking on the pages listed below, or by using the keyword search tool below to find specific information within the annual report.-
 1
1 -
2
-
3
-
4
-
5
-
6
-
7
-
8
-
9
-
10
-
11
-
12
-
13
-
14
-
15
-
16
-
17
-
18
-
19
-
20
-
21
-
22
-
23
-
 24
24 -
 25
25 -
 26
26 -
 27
27 -
 28
28 -
 29
29 -
 30
30 -
 31
31 -
 32
32 -
 33
33 -
 34
34 -
 35
35 -
 36
36 -
 37
37 -
 38
38 -
 39
39 -
 40
40 -
 41
41 -
 42
42 -
 43
43 -
 44
44 -
45
-
46
-
47
-
48
-
49
-
50
-
51
-
52
-
53
-
54
-
55
-
56
-
57
-
58
-
59
-
60
-
61
-
62
-
63
-
64
-
65
-
66
-
67
-
68
-
69
-
70
-
71
-
72
-
73
-
74
-
75
-
76
-
77
-
78
-
79
-
80
-
81
-
82
-
83
-
84
-
85
-
86
-
87
-
88
-
89
-
90
-
91
-
92
 |
 |
30
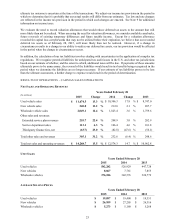
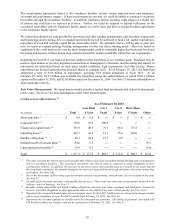
Fiscal 2015 Versus Fiscal 2014. SG&A expenses for fiscal 2015 were reduced by $20.9 million, or $0.06 per share,
which represented our receipt of settlement proceeds in a class action lawsuit related to the economic loss associated
with certain Toyota vehicles. Excluding this gain, SG&A expenses grew 10.7% in fiscal 2015. This increase reflected
the combination of several factors, including the 10% increase in our store base during fiscal 2015 (representing the
addition of 13 stores), higher variable selling costs resulting from the 4.4% increase in comparable store used unit
sales, and an $11.5 million increase in share-based compensation expense, which was influenced by the 39% increase
in the per share price of our common stock from February 28, 2014 to February 28, 2015. Excluding the settlement
gain, SG&A per retail unit was $2,163 in fiscal 2015, similar to the fiscal 2014 level.
Fiscal 2014 Versus Fiscal 2013. The 12.0% increase in SG&A expense in fiscal 2014 reflected the 11% increase in
our store base (representing the addition of 13 stores) and higher variable selling costs resulting from the 12.2%
increase in comparable store used unit sales. SG&A costs were also affected by the increase in the rate of our store
openings, from 10 stores in fiscal 2013 to 13 stores in fiscal 2014. SG&A per retail unit declined as our comparable
store used unit sales growth generated overhead leverage.
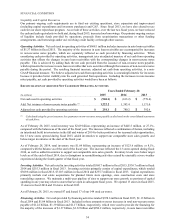
Interest Expense
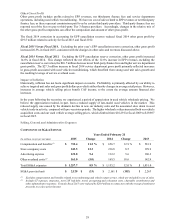
Fiscal 2015 Versus Fiscal 2014. Interest expense declined to $24.5 million in fiscal 2015 versus $30.8 million in
fiscal 2014. During fiscal 2015, we capitalized $8.9 million in interest costs associated with construction costs of
certain facilities. Excluding the capitalized interest costs, the year-over-year increase in interest expense primarily
reflected interest expense on a $300 million term loan entered into in November 2014.
Fiscal 2014 Versus Fiscal 2013. Interest expense declined to $30.8 million in fiscal 2014 versus $32.4 million in
fiscal 2013. In both years, the interest related primarily to our outstanding finance and capital lease obligations.
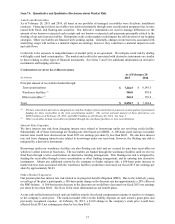
Income Taxes
The effective income tax rate was 38.4% in fiscal 2015, 38.2% in fiscal 2014 and 38.1% in fiscal 2013.
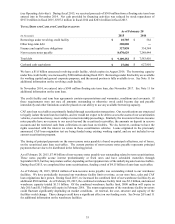
RESULTS OF OPERATIONS – CARMAX AUTO FINANCE
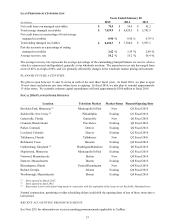
CAF income primarily reflects interest and fee income generated by CAF’s portfolio of auto loan receivables less the
interest expense associated with the debt issued to fund these receivables, a provision for estimated loan losses and
direct CAF expenses. CAF income does not include any allocation of indirect costs. Although CAF benefits from
certain indirect overhead expenditures, we have not allocated indirect costs to CAF to avoid making subjective allocation
decisions. Examples of indirect costs not allocated to CAF include retail store expenses and corporate expenses such as
human resources, administrative services, marketing, information systems, accounting, legal, treasury and executive
payroll.
CAF’s managed portfolio is composed primarily of loans originated over the past several years. Trends in receivable
growth and interest margins primarily reflect the cumulative effect of changes in the business over a multi-year period.
Trends in portfolio losses and delinquencies are affected by changes in our origination strategies over time, as well as
current economic conditions. Current period originations reflect current trends in both our retail sales and the CAF
business, including the volume of loans originated, current interest rates charged to consumers, loan terms and average
credit scores. Because we recognize CAF income over the life of the underlying auto loan, loans originated in a given
fiscal period generally do not have a significant effect on that period’s financial results.
See Note 3 for additional information on CAF income and Note 4 for information on auto loan receivables, including
credit quality.