CarMax 2015 Annual Report Download - page 29
Download and view the complete annual report
Please find page 29 of the 2015 CarMax annual report below. You can navigate through the pages in the report by either clicking on the pages listed below, or by using the keyword search tool below to find specific information within the annual report.-
 1
1 -
2
-
3
-
4
-
5
-
6
-
7
-
8
-
9
-
10
-
11
-
12
-
13
-
14
-
15
-
16
-
17
-
18
-
 19
19 -
 20
20 -
 21
21 -
 22
22 -
 23
23 -
 24
24 -
 25
25 -
 26
26 -
 27
27 -
 28
28 -
 29
29 -
 30
30 -
 31
31 -
 32
32 -
 33
33 -
 34
34 -
 35
35 -
 36
36 -
 37
37 -
 38
38 -
 39
39 -
40
-
41
-
42
-
43
-
44
-
45
-
46
-
47
-
48
-
49
-
50
-
51
-
52
-
53
-
54
-
55
-
56
-
57
-
58
-
59
-
60
-
61
-
62
-
63
-
64
-
65
-
66
-
67
-
68
-
69
-
70
-
71
-
72
-
73
-
74
-
75
-
76
-
77
-
78
-
79
-
80
-
81
-
82
-
83
-
84
-
85
-
86
-
87
-
88
-
89
-
90
-
91
-
92
 |
 |

25
ultimate tax outcome is uncertain at the time of the transactions. We adjust our income tax provision in the period in
which we determine that it is probable that our actual results will differ from our estimates. Tax law and rate changes
are reflected in the income tax provision in the period in which such changes are enacted. See Note 9 for additional
information on income taxes.
We evaluate the need to record valuation allowances that would reduce deferred tax assets to the amount that will
more likely than not be realized. When assessing the need for valuation allowances, we consider available carrybacks,
future reversals of existing temporary differences and future taxable income. Except for a valuation allowance
recorded for capital loss carryforwards that may not be utilized before their expiration, we believe that our recorded
deferred tax assets as of February 28, 2015, will more likely than not be realized. However, if a change in
circumstances results in a change in our ability to realize our deferred tax assets, our tax provision would be affected
in the period when the change in circumstances occurs.
In addition, the calculation of our tax liabilities involves dealing with uncertainties in the application of complex tax
regulations. We recognize potential liabilities for anticipated tax audit issues in the U.S. and other tax jurisdictions
based on our estimate of whether, and the extent to which, additional taxes will be due. If payments of these amounts
ultimately prove to be unnecessary, the reversal of the liabilities would result in tax benefits being recognized in the
period when we determine the liabilities are no longer necessary. If our estimate of tax liabilities proves to be less
than the ultimate assessment, a further charge to expense would result in the period of determination.
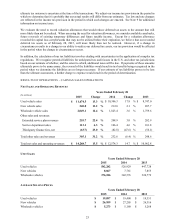
RESULTS OF OPERATIONS – CARMAX SALES OPERATIONS
NET SALES AND OPERATING REVENUES
Years Ended February 28
(In millions) 2015 Change 2014 Change 2013
Used vehicle sales $ 11,674.5 13.3 % $ 10,306.3 17.8 % $ 8,747.0
N
ew vehicle sales 240.0 13.2 % 212.0 2.1 % 207.7
Wholesale vehicle sales 2,049.1 12.4 % 1,823.4 3.6 % 1,759.6
Other sales and revenues:
Extended service plan revenues 255.7 22.4 % 208.9 3.0 % 202.9
Service department sales 113.1 6.3 % 106.4 4.6 % 101.8
Third-party finance fees, net (63.7) 23.0 % (82.8) (47.6) % (56.1)
Total other sales and revenues 305.1 31.2 % 232.6 (6.4) % 248.6
Total net sales and operating revenues $ 14,268.7 13.5 % $ 12,574.3 14.7 % $ 10,962.8
UNIT SALES
Years Ended February 28
2015 2014 2013
Used vehicles 582,282 526,929 447,728
N
ew vehicles 8,867 7,761 7,855
Wholesale vehicles 376,186 342,576 324,779
AVERAGE SELLING PRICES
Years Ended February 28
2015 2014 2013
Used vehicles $ 19,897 $ 19,408 $ 19,351
N
ew vehicles $ 26,959 $ 27,205 $ 26,316
Wholesale vehicles $5,273
$ 5,160 $ 5,268