CarMax 2015 Annual Report Download - page 26
Download and view the complete annual report
Please find page 26 of the 2015 CarMax annual report below. You can navigate through the pages in the report by either clicking on the pages listed below, or by using the keyword search tool below to find specific information within the annual report.-
 1
1 -
2
-
3
-
4
-
5
-
6
-
7
-
8
-
9
-
10
-
11
-
12
-
13
-
14
-
15
-
 16
16 -
 17
17 -
 18
18 -
 19
19 -
 20
20 -
 21
21 -
 22
22 -
 23
23 -
 24
24 -
 25
25 -
 26
26 -
 27
27 -
 28
28 -
 29
29 -
 30
30 -
 31
31 -
 32
32 -
 33
33 -
 34
34 -
 35
35 -
 36
36 -
37
-
38
-
39
-
40
-
41
-
42
-
43
-
44
-
45
-
46
-
47
-
48
-
49
-
50
-
51
-
52
-
53
-
54
-
55
-
56
-
57
-
58
-
59
-
60
-
61
-
62
-
63
-
64
-
65
-
66
-
67
-
68
-
69
-
70
-
71
-
72
-
73
-
74
-
75
-
76
-
77
-
78
-
79
-
80
-
81
-
82
-
83
-
84
-
85
-
86
-
87
-
88
-
89
-
90
-
91
-
92
 |
 |
22
Item 7. Management’s Discussion and Analysis of Financial Condition and Results of Operations.
The following Management’s Discussion and Analysis of Financial Condition and Results of Operations (“MD&A”)
is provided as a supplement to, and should be read in conjunction with, our audited consolidated financial statements
and the accompanying notes presented in Item 8, Consolidated Financial Statements and Supplementary Data. Note
references are to the notes to consolidated financial statements included in Item 8. Certain prior year amounts have
been reclassified to conform to the current year’s presentation. All references to net earnings per share are to diluted
net earnings per share. Amounts and percentages may not total due to rounding.
OVERVIEW
See Part 1. Item 1 for a detailed description and discussion of the company’s business.
CarMax is the nation’s largest retailer of used vehicles. We operate in two reportable segments: CarMax Sales
Operations and CarMax Auto Finance (“CAF”). Our CarMax Sales Operations segment consists of all aspects of our
auto merchandising and service operations, excluding financing provided by CAF. Our CAF segment consists solely
of our own finance operation that provides vehicle financing through CarMax stores.
CarMax Sales Operations
Our sales operations segment consists of retail sales of used vehicles and related products and services, such as
wholesale vehicle sales; the sale of extended protection plan (“EPP”) products, which include extended service plans
(“ESP”) and guaranteed asset protection (“GAP”); and vehicle repair service. GAP is designed to cover the unpaid
balance on an auto loan in the event of a total loss of the vehicle or unrecovered theft. We focus on addressing the
major sources of customer dissatisfaction with traditional auto retailers while maximizing operating efficiencies. We
offer low, no-haggle prices; a broad selection of CarMax Quality Certified used vehicles; value-added EPP products;
and superior customer service.
Our customers finance the majority of the retail vehicles purchased from us, and the availability of on-the-spot
financing is a critical component of the sales process. We provide financing to qualified retail customers through
CAF and our arrangements with several industry-leading third-party finance providers. All of the finance offers,
whether by CAF or our third-party providers, are backed by a 3-day payoff option.
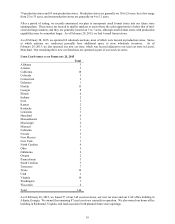
As of February 28, 2015, we operated 144 used car stores in 73 markets, covering 47 mid-sized markets, 20 large
markets and 6 small markets. We define mid-sized markets as those with television viewing populations generally
between 600,000 and 3 million people. As of that date, we also conducted wholesale auctions at 62 used car stores
and we operated four new car franchises.
CarMax Auto Finance
In addition to third-party financing providers, we provide vehicle financing through CAF, which offers financing
solely to our customers in our stores. CAF allows us to manage our reliance on third-party financing providers and to
leverage knowledge of our business to provide qualifying customers a competitive financing option. As a result, we
believe CAF enables us to capture additional profits, cash flows and sales. After the effect of 3-day payoffs and
vehicle returns, CAF financed 41.2% of our retail vehicle unit sales in fiscal 2015. As of February 28, 2015, CAF
serviced approximately 619,000 customer accounts in its $8.46 billion portfolio of managed receivables.
Management regularly analyzes CAF’s operating results by assessing the competitiveness of our consumer offer,
profitability, the performance of the auto loan receivables including trends in credit losses and delinquencies, and CAF
direct expenses.
Revenues and Profitability
During fiscal 2015, net sales and operating revenues increased 13.5%, net earnings grew 21.3% and net earnings per
share increased 26.4%. These year-over-year comparisons benefited from the receipt of proceeds in a class action
lawsuit in fiscal 2015 and a correction to our accounting related to cancellation reserves for EPP products in
fiscal 2014. Excluding these items, fiscal 2015 net earnings grew 15.9% and net earnings per share increased 20.3%.
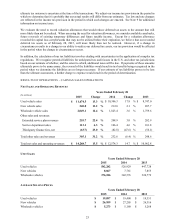
Our primary source of revenue and net income is the retail sale of used vehicles. During fiscal 2015, we sold 582,282
used cars, representing 98.5% of the total 591,149 vehicles we sold at retail, 81.8% of our net sales and operating
revenues and 67.2% of our gross profit. Used vehicle unit sales grew 10.5%, including a 4.4% increase in comparable
store used units and sales from newer stores not yet included in the comparable store base.