CarMax 2015 Annual Report Download - page 47
Download and view the complete annual report
Please find page 47 of the 2015 CarMax annual report below. You can navigate through the pages in the report by either clicking on the pages listed below, or by using the keyword search tool below to find specific information within the annual report.-
 1
1 -
2
-
3
-
4
-
5
-
6
-
7
-
8
-
9
-
10
-
11
-
12
-
13
-
14
-
15
-
16
-
17
-
18
-
19
-
20
-
21
-
22
-
23
-
24
-
25
-
26
-
27
-
28
-
29
-
30
-
31
-
32
-
33
-
34
-
35
-
36
-
 37
37 -
 38
38 -
 39
39 -
 40
40 -
 41
41 -
 42
42 -
 43
43 -
 44
44 -
 45
45 -
 46
46 -
 47
47 -
 48
48 -
 49
49 -
 50
50 -
 51
51 -
 52
52 -
 53
53 -
 54
54 -
 55
55 -
 56
56 -
 57
57 -
58
-
59
-
60
-
61
-
62
-
63
-
64
-
65
-
66
-
67
-
68
-
69
-
70
-
71
-
72
-
73
-
74
-
75
-
76
-
77
-
78
-
79
-
80
-
81
-
82
-
83
-
84
-
85
-
86
-
87
-
88
-
89
-
90
-
91
-
92
 |
 |

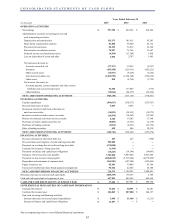
CONSOLIDATED STATEMENTS OF CASH FLOWS
See accompanying notes to consolidated financial statements.
43
\
Years Ended February 28
(In thousands) 2015 2014 2013
OPERATING ACTIVITIES:
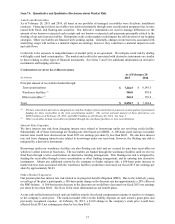
Net earnings $ 597,358 $ 492,586 $ 434,284
Adjustments to reconcile net earnings to net cash
used in operating activities:
Depreciation and amortization 115,173
101,911 95,283
Share-based compensation expense 81,880
66,480 62,112
Provision for loan losses 82,343
72,212 56,168
Provision for cancellation reserves 70,987
76,746 31,667
Deferred income tax (benefit) provision (4,299) (17,185) 3,858
Loss on disposition of assets and other 3,852
2,707 1,945
Net (increase) decrease in:
Accounts receivable, net (57,767) 12,038 (5,527)
Inventory (445,450) (123,611) (425,221)
Other current assets (16,947) (3,019) (3,252)
Auto loan receivables, net (1,369,999) (1,324,142) (992,239)
Other assets 825
(6,754) (1,722)
Net increase (decrease) in:
Accounts payable, accrued expenses and other current
liabilities and accrued income taxes 51,960
117,405 (575)
Other liabilities (78,046) (80,537) (35,222)
NET CASH USED IN OPERATING ACTIVITIES (968,130) (613,163) (778,441)
INVESTING ACTIVITIES:
Capital expenditures (309,817) (310,317) (235,707)
Proceeds from sales of assets 5,869
5,095 ―
Increase in restricted cash from collections on
auto loan receivables (34,823) (35,012) (19,973)
Increase in restricted cash in reserve accounts (16,556) (10,403) (13,385)
Release of restricted cash from reserve accounts 6,346
19,202 17,368
Purchases of money market securities, net (8,604) (3,661) (2,139)
Purchases of trading securities (3,814) (2,051) (31,756)
Sales of trading securities 655
466 30,318
NET CASH USED IN INVESTING ACTIVITIES (360,744) (336,681) (255,274)
FINANCING ACTIVITIES:
Increase (decrease) in short-term debt, net 203
227 (588)
Proceeds from revolving line of credit and long-term debt 985,000
― ―
Payments on revolving line of credit and long-term debt (675,000) ― ―
Cash paid for issuance of long-term debt (1,190) ― ―
Payments on finance and capital lease obligations (18,243) (19,596) (14,083)
Issuances of non-recourse notes payable 7,783,000
6,907,000 5,851,000
Payments on non-recourse notes payable (6,560,815) (5,513,646) (4,679,999)
Repurchase and retirement of common stock (916,981) (307,248) (203,405)
Equity issuances, net 82,463
39,000 63,396
Excess tax benefits from share-based payment arrangements 50,142
22,644 24,100
NET CASH PROVIDED BY FINANCING ACTIVITIES 728,579 1,128,381
1,040,421
(Decrease) increase in cash and cash equivalents (600,295) 178,537
6,706
Cash and cash equivalents at beginning of year 627,901
449,364 442,658
CASH AND CASH EQUIVALENTS AT END OF YEAR $ 27,606 $ 627,901 $ 449,364
SUPPLEMENTAL DISCLOSURES OF CASH FLOW INFORMATION
Cash paid for interest $ 33,043 $ 30,991 $ 32,601
Cash paid for income taxes $ 346,865 $ 287,000 $ 244,337
Non-cash investing and financing activities:
Increase (decrease) in accrued capital expenditures $ 3,698 $ 11,468 $ (1,211)
Increase in finance and capital lease obligations $ 11,697 $ ― $ ―