CarMax 2015 Annual Report Download - page 72
Download and view the complete annual report
Please find page 72 of the 2015 CarMax annual report below. You can navigate through the pages in the report by either clicking on the pages listed below, or by using the keyword search tool below to find specific information within the annual report.-
 1
1 -
2
-
3
-
4
-
5
-
6
-
7
-
8
-
9
-
10
-
11
-
12
-
13
-
14
-
15
-
16
-
17
-
18
-
19
-
20
-
21
-
22
-
23
-
24
-
25
-
26
-
27
-
28
-
29
-
30
-
31
-
32
-
33
-
34
-
35
-
36
-
37
-
38
-
39
-
40
-
41
-
42
-
43
-
44
-
45
-
46
-
47
-
48
-
49
-
50
-
51
-
52
-
53
-
54
-
55
-
56
-
57
-
58
-
59
-
60
-
61
-
 62
62 -
 63
63 -
 64
64 -
 65
65 -
 66
66 -
 67
67 -
 68
68 -
 69
69 -
 70
70 -
 71
71 -
 72
72 -
 73
73 -
 74
74 -
 75
75 -
 76
76 -
 77
77 -
 78
78 -
 79
79 -
 80
80 -
 81
81 -
 82
82 -
83
-
84
-
85
-
86
-
87
-
88
-
89
-
90
-
91
-
92
 |
 |

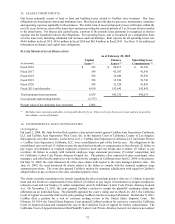
68
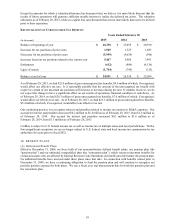
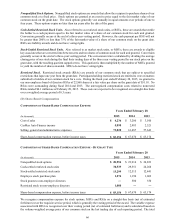
ASSUMPTIONS USED TO ESTIMATE OPTION VALUES
Years Ended February 28
2015 2014 2013
Dividend yield 0.0 %
0.0 % 0.0 %
Expected volatility factor (1) 25.2 % - 32.7 % 27.9 % - 46.8 % 31.1 % - 51.4 %
Weighted average expected volatility 31.8 %
44.7 % 49.4 %
Risk-free interest rate (2) 0.01 % - 2.7 % 0.02 % - 2.6 % 0.02 % - 2.0 %
Expected term (in years) (3) 4.7
4.7 4.7
(1) Measured using historical daily price changes of our stock for a period corresponding to the term of the options and the
implied volatility derived from the market prices of traded options on our stock.
(2) Based on the U.S. Treasury yield curve at the time of grant.
(3) Represents the estimated number of years that options will be outstanding prior to exercise.
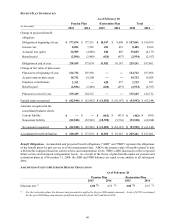
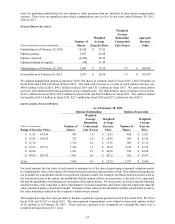
CASH-SETTLED RESTRICTED STOCK UNIT ACTIVITY
Weighted
Average
Number of Grant Date
(Units in thousands) Units
Fair Value
Outstanding as of February 28, 2014 1,531 $ 35.68
Stock units granted 588 $ 44.96
Stock units vested and converted (474) $ 32.93
Stock units cancelled (115) $ 39.55
Outstanding as of February 28, 2015 1,530 $ 39.81
We granted 587,990 RSUs in fiscal 2015, 541,819 RSUs in fiscal 2014 and 644,232 RSUs in fiscal 2013. The initial
fair market value per RSU at the date of grant was $44.96 in fiscal 2015, $42.68 in fiscal 2014 and $31.76 in
fiscal 2013. The RSUs are cash-settled upon vesting. During fiscal 2015, we paid $21.8 million (before payroll tax
withholdings) to RSU holders upon the vesting of RSUs, and we realized tax benefits of $8.8 million.
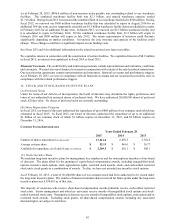
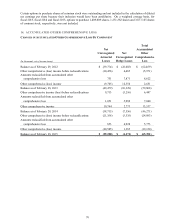
EXPECTED CASH SETTLEMENT RANGE UPON RESTRICTED STOCK UNIT VESTING
As of February 28, 2015
(In thousands) Minimum (1) Maximum (1)
Fiscal 2016 $ 12,180 $ 32,479
Fiscal 2017 13,950 37,199
Fiscal 2018 16,137 43,033
Total expected cash settlements $ 42,267 $ 112,711
(1) Net of estimated forfeitures.