CarMax 2015 Annual Report Download - page 35
Download and view the complete annual report
Please find page 35 of the 2015 CarMax annual report below. You can navigate through the pages in the report by either clicking on the pages listed below, or by using the keyword search tool below to find specific information within the annual report.-
 1
1 -
2
-
3
-
4
-
5
-
6
-
7
-
8
-
9
-
10
-
11
-
12
-
13
-
14
-
15
-
16
-
17
-
18
-
19
-
20
-
21
-
22
-
23
-
24
-
 25
25 -
 26
26 -
 27
27 -
 28
28 -
 29
29 -
 30
30 -
 31
31 -
 32
32 -
 33
33 -
 34
34 -
 35
35 -
 36
36 -
 37
37 -
 38
38 -
 39
39 -
 40
40 -
 41
41 -
 42
42 -
 43
43 -
 44
44 -
 45
45 -
46
-
47
-
48
-
49
-
50
-
51
-
52
-
53
-
54
-
55
-
56
-
57
-
58
-
59
-
60
-
61
-
62
-
63
-
64
-
65
-
66
-
67
-
68
-
69
-
70
-
71
-
72
-
73
-
74
-
75
-
76
-
77
-
78
-
79
-
80
-
81
-
82
-
83
-
84
-
85
-
86
-
87
-
88
-
89
-
90
-
91
-
92
 |
 |

31
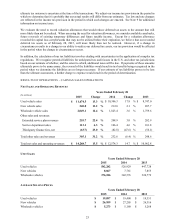
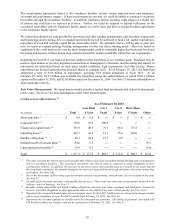
COMPONENTS OF CAF INCOME
Years Ended February 28
(In millions) 2015 % (1) 2014 % (1) 2013 % (1)
Interest margin:
Interest and fee income $604.9 7.7
$ 548.0 8.3 $ 495.3 9.2
Interest expense (96.6) (1.2) (90.0) (1.4) (95.1) (1.8)
Total interest margin 508.3 6.5 458.0 6.9 400.2 7.4
Provision for loan losses (82.3) (1.0) (72.2) (1.1) (56.2) (1.0)
Total interest margin after
provision for loan losses 426.0 5.4 385.8 5.8 344.0 6.4
Other income ― ― 0.1 ― ― ―
Total direct expenses (58.7) (0.7) (49.7) (0.8) (44.7) (0.8)
CarMax Auto Finance income $367.3 4.7
$ 336.2 5.1 $ 299.3 5.6
Total average managed receivables $ 7,859.9 $ 6,629.5 $ 5,385.5
(1) Percent of total average managed receivables.
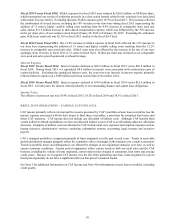
Fiscal 2015 Versus Fiscal 2014. The 9.3% increase in CAF income resulted from the growth in CAF’s average
managed receivables, partially offset by a lower total interest margin as a percent of average managed receivables.
Average managed receivables grew 18.6% to $7.86 billion in fiscal 2015.
Total interest margin, which reflects the spread between interest and fees charged to consumers and our funding costs,
declined as a percentage of total average managed receivables to 6.5% in fiscal 2015 from 6.9% in fiscal 2014. This
reflected the combination of (i) a gradual decline in the average contract rate charged on new loan originations in
recent years with (ii) an increase in our average funding costs for more recent securitizations. Changes in the interest
margin on new originations affect CAF income over time as these loans come to represent an increasing percentage
of managed receivables. Rising interest rates, which affect CAF’s funding costs, or further competitive pressures on
consumer rates could result in further compression in the interest margin on new originations.
Fiscal 2014 Versus Fiscal 2013. The 12.3% increase in CAF income resulted from the growth in CAF’s managed
receivables, partially offset by a lower total interest margin rate. Average managed receivables grew 23.1% to
$6.63 billion in fiscal 2014.
Total interest margin declined to 6.9% in fiscal 2014 from 7.4% in fiscal 2013. A strategic decision made in mid-
fiscal 2013 to provide more competitive finance offers contributed to both the decline in the weighted average contract
rate on loan originations to 7.0% in fiscal 2014 from 7.9% in fiscal 2013, and to the decline in total interest margin.