CarMax 2015 Annual Report Download - page 27
Download and view the complete annual report
Please find page 27 of the 2015 CarMax annual report below. You can navigate through the pages in the report by either clicking on the pages listed below, or by using the keyword search tool below to find specific information within the annual report.-
 1
1 -
2
-
3
-
4
-
5
-
6
-
7
-
8
-
9
-
10
-
11
-
12
-
13
-
14
-
15
-
16
-
 17
17 -
 18
18 -
 19
19 -
 20
20 -
 21
21 -
 22
22 -
 23
23 -
 24
24 -
 25
25 -
 26
26 -
 27
27 -
 28
28 -
 29
29 -
 30
30 -
 31
31 -
 32
32 -
 33
33 -
 34
34 -
 35
35 -
 36
36 -
 37
37 -
38
-
39
-
40
-
41
-
42
-
43
-
44
-
45
-
46
-
47
-
48
-
49
-
50
-
51
-
52
-
53
-
54
-
55
-
56
-
57
-
58
-
59
-
60
-
61
-
62
-
63
-
64
-
65
-
66
-
67
-
68
-
69
-
70
-
71
-
72
-
73
-
74
-
75
-
76
-
77
-
78
-
79
-
80
-
81
-
82
-
83
-
84
-
85
-
86
-
87
-
88
-
89
-
90
-
91
-
92
 |
 |

23
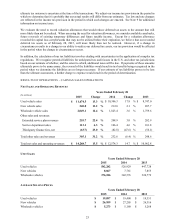
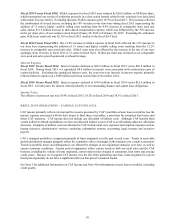
Wholesale sales are also a significant contributor to our revenues and net income. During fiscal 2015, we sold 376,186
wholesale vehicles, representing 14.4% of our net sales and operating revenues and 19.3% of our gross profit.
Wholesale vehicle unit sales grew 9.8%, reflecting improved appraisal traffic and the growth in our store base.
During fiscal 2015, other sales and revenues, which include commissions earned on the sale of EPP products, service
department sales and net third-party finance fees, increased 31.2%. Excluding the prior year’s EPP cancellation
reserve correction, other sales and revenues grew 21.0%, primarily due to the growth in retail unit sales. These items
represented 13.1% of our gross profit.
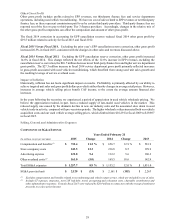
Income from our CAF segment totaled $367.3 million in fiscal 2015, up 9.3% compared with fiscal 2014. CAF
income primarily reflects the interest and fee income generated by the auto loan receivables less the interest expense
associated with the debt issued to fund these receivables, a provision for estimated loan losses and direct CAF
expenses. CAF income does not include any allocation of indirect costs.
Liquidity
Our primary ongoing sources of liquidity include funds provided by operations, proceeds from securitization
transactions, and borrowings under our revolving credit facility or through other sources. During fiscal 2015, liquidity
was primarily provided by $1.22 billion in net issuances of non-recourse notes payable, $627.9 million of cash and
cash equivalents on hand at the start of the year, a $300 million term loan and $254.1 million of adjusted net cash
provided by operations, a non-GAAP measure. This liquidity was primarily used to fund the increase in CAF auto
loan receivables, the 17.5 million common shares repurchased under our share repurchase program and our store
growth.
In fiscal 2015, net cash used in operating activities totaled $968.1 million, while net cash provided by operating activities
excluding the increase in securitized auto loan receivables equaled $254.1 million. When considering cash provided by
operating activities, management does not include increases in auto loan receivables that have been securitized with non-
recourse notes payable, which are separately reflected as cash provided by financing activities. For a reconciliation of
adjusted net cash provided by operations to net cash used in operating activities, the most directly comparable GAAP
financial measure, see “Reconciliation of Adjusted Net Cash from Operating Activities” included in “FINANCIAL
CONDITION - Liquidity and Capital Resources.”
Future Outlook
Over the long term, we believe the primary driver for earnings growth will be vehicle unit sales growth from both new
stores and stores included in our comparable store base. We also believe that increased used vehicle unit sales will
drive increased sales of wholesale vehicles and ancillary products and, over time, increased CAF income. To expand
our vehicle unit sales at new and existing stores, we will need to continue delivering an unrivaled customer experience
and hiring and developing the associates necessary to drive our success, while managing the risks posed by an evolving
competitive environment. In addition, to support our store growth plans, we will need to continue procuring suitable
real estate at favorable terms.
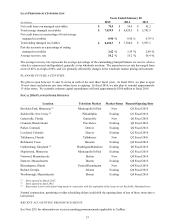
We are still in the midst of the national rollout of our retail concept, and as of February 28, 2015, we had used car
stores located in markets that comprised approximately 61% of the U.S. population. We opened 10 stores in fiscal
2013, 13 stores in fiscal 2014 and 13 stores in fiscal 2015. We currently plan to open between 13 and 16 stores in
each of the next three fiscal years. In fiscal 2016, we plan to open 14 new stores and relocate one store whose lease
is expiring. See “Fiscal 2016 Planned Store Openings” included elsewhere in MD&A for a detailed list of fiscal 2016
planned store openings.
See “Risk Factors,” included in Part I. Item 1A of this Form 10-K for additional information about risks and
uncertainties facing our Company.