CarMax 2015 Annual Report Download - page 61
Download and view the complete annual report
Please find page 61 of the 2015 CarMax annual report below. You can navigate through the pages in the report by either clicking on the pages listed below, or by using the keyword search tool below to find specific information within the annual report.-
 1
1 -
2
-
3
-
4
-
5
-
6
-
7
-
8
-
9
-
10
-
11
-
12
-
13
-
14
-
15
-
16
-
17
-
18
-
19
-
20
-
21
-
22
-
23
-
24
-
25
-
26
-
27
-
28
-
29
-
30
-
31
-
32
-
33
-
34
-
35
-
36
-
37
-
38
-
39
-
40
-
41
-
42
-
43
-
44
-
45
-
46
-
47
-
48
-
49
-
50
-
 51
51 -
 52
52 -
 53
53 -
 54
54 -
 55
55 -
 56
56 -
 57
57 -
 58
58 -
 59
59 -
 60
60 -
 61
61 -
 62
62 -
 63
63 -
 64
64 -
 65
65 -
 66
66 -
 67
67 -
 68
68 -
 69
69 -
 70
70 -
 71
71 -
72
-
73
-
74
-
75
-
76
-
77
-
78
-
79
-
80
-
81
-
82
-
83
-
84
-
85
-
86
-
87
-
88
-
89
-
90
-
91
-
92
 |
 |

57
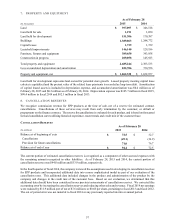
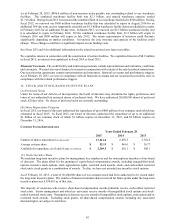
7. PROPERTY AND EQUIPMENT
As of February 28
(In thousands) 2015 2014
Land $ 397,097 $ 346,518
Land held for sale 1,191 1,050
Land held for development 151,306 170,387
Buildings 1,389,063 1,244,772
Capital leases 1,739 1,739
Leasehold improvements 146,140 129,186
Furniture, fixtures and equipment 389,650 343,958
Construction in progress 209,058 145,923
Total property and equipment 2,685,244 2,383,533
Less accumulated depreciation and amortization 822,706 730,556
Property and equipment, net $ 1,862,538 $ 1,652,977
Land held for development represents land owned for potential store growth. Leased property meeting capital lease
criteria is capitalized and the present value of the related lease payments is recorded as long-term debt. Amortization
of capital leased assets is included in depreciation expense, and accumulated amortization was $0.4 million as of
February 28, 2015 and $0.3 million as of February 28, 2014. Depreciation expense was $105.7 million in fiscal 2015,
$90.4 million in fiscal 2014 and $82.3 million in fiscal 2013.
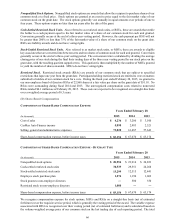
8. CANCELLATION RESERVES
We recognize commission revenue for EPP products at the time of sale, net of a reserve for estimated contract
cancellations. Cancellations of these services may result from early termination by the customer, or default or
prepayment on the finance contract. The reserve for cancellations is evaluated for each product, and is based on forecasted
forward cancellation curves utilizing historical experience, recent trends and credit mix of the customer base.
CANCELLATION RESERVES
As of Februar
y
28
(In millions) 2015 2014
Balance as of beginning of year $ 72.5 $ 32.7
Cancellations (49.1) (36.9)
Provision for future cancellations 71.0 76.7
Balance as of end of year $ 94.4 $ 72.5
The current portion of estimated cancellation reserves is recognized as a component of other accrued expenses with
the remaining amount recognized in other liabilities. As of February 28, 2015 and 2014, the current portion of
cancellation reserves was $44.8 million and $33.9 million, respectively.
In the fourth quarter of fiscal 2014, the company reviewed the assumptions used in developing its cancellation reserves
for EPP products and incorporated additional data into a more sophisticated model as part of our evaluation of the
cancellation rates. This additional data included changes in the product and administration of the product by the
company and changes in the credit mix of the customer base. Based on our evaluation, we determined that this
additional data should have been considered in our previous assessments of cancellation reserves. We corrected this
accounting error by increasing the cancellation reserves and reducing other sales and revenue. Fiscal 2014 net earnings
were reduced by $11.9 million (net of tax of $7.6 million), or $0.05 per share, pertaining to fiscal 2013 and fiscal 2012.
The out of period error was not material to fiscal 2014 or any previously reported interim or annual period.