CarMax 2015 Annual Report Download - page 3
Download and view the complete annual report
Please find page 3 of the 2015 CarMax annual report below. You can navigate through the pages in the report by either clicking on the pages listed below, or by using the keyword search tool below to find specific information within the annual report.-
 1
1 -
 2
2 -
 3
3 -
 4
4 -
 5
5 -
 6
6 -
 7
7 -
 8
8 -
 9
9 -
 10
10 -
 11
11 -
 12
12 -
 13
13 -
 14
14 -
15
-
16
-
17
-
18
-
19
-
20
-
21
-
22
-
23
-
24
-
25
-
26
-
27
-
28
-
29
-
30
-
31
-
32
-
33
-
34
-
35
-
36
-
37
-
38
-
39
-
40
-
41
-
42
-
43
-
44
-
45
-
46
-
47
-
48
-
49
-
50
-
51
-
52
-
53
-
54
-
55
-
56
-
57
-
58
-
59
-
60
-
61
-
62
-
63
-
64
-
65
-
66
-
67
-
68
-
69
-
70
-
71
-
72
-
73
-
74
-
75
-
76
-
77
-
78
-
79
-
80
-
81
-
82
-
83
-
84
-
85
-
86
-
87
-
88
-
89
-
90
-
91
-
92
 |
 |

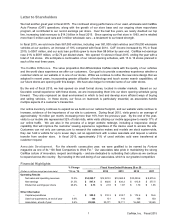
1 CarMax, Inc. Fiscal 2015
Letter to Shareholders
We had another great year in fiscal 2015. The continued strong performance of our used, wholesale and CarMax
Auto Finance (CAF) operations, along with the growth of our store base and our ongoing share repurchase
program, all contributed to our record earnings per share. Over the last five years, we nearly doubled our top
line, increasing total revenues to $14.3 billion in fiscal 2015. Since opening our first store in 1993, we’ve retailed
more than 5 million used cars and 3 million wholesale cars – a testament to our brand strength.
In fiscal 2015, we sold more than 967,000 vehicles, including over 591,000 retail vehicles and 376,000 wholesale
vehicles at our auctions, an increase of 10% compared with fiscal 2014. CAF income increased by 9% in fiscal
2015, to $367 million, and our auto loan portfolio grew to more than $8 billion by year end. CarMax net earnings
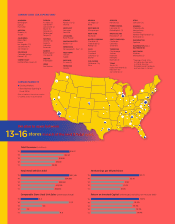
rose 21% to $597 million, or $2.73 per diluted share. We opened 13 stores in fiscal 2015, ending the year with a
total of 144 stores. We anticipate a continuation of our robust opening schedule, with 13 to 16 stores planned in
each of the next three years.
The CarMax Difference. The value proposition that differentiates CarMax starts with the quality of our vehicles
and the world class experience we offer our customers. Our goal is to provide a seamless experience whether a
customer starts on our website or in one of our stores. While we continue to refine the new store design that we
adopted in recent years, incorporating greater utilization of technology and touch screen search capabilities, all
our future stores are opening with this design. We have also begun to remodel some of our older stores.
By the end of fiscal 2015, we had opened six small format stores, located in smaller markets. Based on our
favorable overall experience with these stores, we are incorporating them into our store opening schedule going
forward. They also represent an ideal environment in which to test and develop more efficient ways of buying
and selling vehicles. In these stores, our focus on teamwork is particularly essential, as associates handle
multiple aspects of a customer’s transaction.
Our online inventory continues to expand as we build out our national footprint, and our website visits continue to
increase, evidence of the importance of our site to customers. During fiscal 2015, visits grew to an average of
approximately 14 million per month, increasing more than 16% from the previous year. By the end of the year,
visits to our mobile site represented 32% of total visits, while visits utilizing our mobile apps grew to nearly 17% of
our online traffic. We are also in the process of a larger website redesign, including a responsive design
capability that will improve the customer viewing experience regardless of the device used to access the site.
Customers can not only use carmax.com to research the extensive makes and models we stock system-wide,
they can hold a vehicle for up to seven days, set an appointment with a sales associate and request a vehicle
transfer from another store. In fiscal 2015, approximately 31% of used vehicles sold were transferred at
customer request.
Associate Development. For the eleventh consecutive year, we were gratified to be named by Fortune
magazine as one of its “100 Best Companies to Work For.” Our associates take pride in maintaining the strong
CarMax culture of innovation, respect and integrity – and are dedicated to cultivating that culture as we continue
to expand across the country. By investing in the well-being of our associates, which is our greatest competitive
Financial Highlights
% Change Fiscal Years Ended February 28 or 29
(Dollars in millions except per share data) ‘15 vs. ‘14 2015 2014 2013 2012 2011
Operating Results
Net sales and operating revenues 13.5% $ 14,268.7 $ 12,574.3 $10,962.8 $10,003.6 $ 8,975.6
Net earnings 21.3% $ 597.4 $ 492.6 $ 434.3 $ 413.8 $ 377.5
Diluted net earnings per share 26.4% $ 2.73 $ 2.16 $ 1.87 $ 1.79 $ 1.65
Other Information
Capital expenditures -- $ 309.8 $ 310.3 $ 235.7 $ 172.6 $ 76.6
Used car superstores, at end of year 9.9% 144 131 118 108 103
Associates, at end of year 9.4% 22,064 20,171 18,111 16,460 15,565