CarMax 2015 Annual Report Download - page 30
Download and view the complete annual report
Please find page 30 of the 2015 CarMax annual report below. You can navigate through the pages in the report by either clicking on the pages listed below, or by using the keyword search tool below to find specific information within the annual report.-
 1
1 -
2
-
3
-
4
-
5
-
6
-
7
-
8
-
9
-
10
-
11
-
12
-
13
-
14
-
15
-
16
-
17
-
18
-
19
-
 20
20 -
 21
21 -
 22
22 -
 23
23 -
 24
24 -
 25
25 -
 26
26 -
 27
27 -
 28
28 -
 29
29 -
 30
30 -
 31
31 -
 32
32 -
 33
33 -
 34
34 -
 35
35 -
 36
36 -
 37
37 -
 38
38 -
 39
39 -
 40
40 -
41
-
42
-
43
-
44
-
45
-
46
-
47
-
48
-
49
-
50
-
51
-
52
-
53
-
54
-
55
-
56
-
57
-
58
-
59
-
60
-
61
-
62
-
63
-
64
-
65
-
66
-
67
-
68
-
69
-
70
-
71
-
72
-
73
-
74
-
75
-
76
-
77
-
78
-
79
-
80
-
81
-
82
-
83
-
84
-
85
-
86
-
87
-
88
-
89
-
90
-
91
-
92
 |
 |

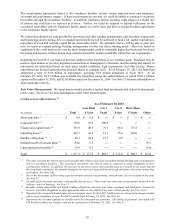
26
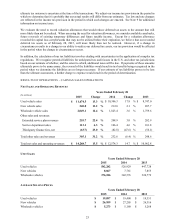
COMPARABLE STORE USED VEHICLE SALES CHANGES
Years Ended February 28
2015 2014 2013
Used vehicle units 4.4 % 12.2 % 5.4 %
Used vehicle dollars 7.0 % 12.4 % 7.5 %
Stores are added to the comparable store base beginning in their fourteenth full month of operation. We do not remove
renovated stores from our comparable store base. Comparable store calculations include results for a set of stores that
were included in our comparable store base in both the current and corresponding prior year periods.
VEHICLE SALES CHANGES
Years Ended February 28
2015 2014 2013
Used vehicle units 10.5 % 17.7 % 9.7 %
Used vehicle revenues 13.3 % 17.8 % 11.8 %
Wholesale vehicle units 9.8 % 5.5 % 2.6 %
Wholesale vehicle revenues 12.4 % 3.6 % 2.2 %
CHANGE IN USED CAR STORE BASE
Years Ended February 28
2015 2014 2013
Used car stores, beginning of year
131 118 108
Store openings
13 13 10
Used car stores, end of year 144 131 118
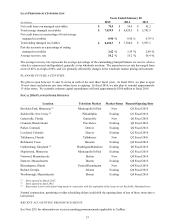
The fiscal 2015 store openings included 10 stores in 9 new markets (1 store each in Rochester, New York; Dothan,
Alabama; Spokane, Washington; Madison, Wisconsin; Lynchburg, Virginia; Tupelo, Mississippi; Reno, Nevada; and
Cleveland, Ohio; and 2 stores in Portland, Oregon) and 3 stores in existing markets (Harrisburg/Lancaster,
Pennsylvania; Dallas, Texas; and Raleigh, North Carolina). The Dothan, Lynchburg, and Tupelo stores are small
format stores.
In recent years, we have tested small format stores, which generally are located in smaller markets where the sales
opportunity is below that of mid-sized and large markets. While these stores are anticipated to sell fewer vehicles
compared with our stores in larger markets, they have a smaller footprint, employ fewer associates and have less
overhead compared with other CarMax stores. Based on performance in our test stores, we are incorporating
additional small format stores into our future store opening plans.
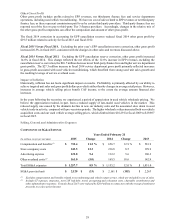
Used Vehicle Sales
Fiscal 2015 Versus Fiscal 2014. The 13.3% increase in used vehicle revenues in fiscal 2015 resulted from a 10.5% increase
in used unit sales and a 2.5% increase in average retail vehicle selling price. The increase in used unit sales included a 4.4%
increase in comparable store used unit sales and sales from newer stores not yet included in the comparable store base. The
comparable store used unit growth reflected improved customer traffic, as well as improved conversion. Our data indicates
that in our markets, we increased our share of the 0- to 10-year old used vehicle market by approximately 5% in
calendar 2014.
The increase in average retail vehicle selling price primarily reflected changes in our sales mix, with an increased mix of
0-to 4-year old vehicles in fiscal 2015. From 2008 through 2012, new car industry sales were at rates significantly below
pre-recession levels, which affected the overall supply and acquisition costs of late-model used vehicles. As the supply of
later-model used vehicles has gradually improved, our inventory mix has shifted accordingly.