CarMax 2015 Annual Report Download - page 36
Download and view the complete annual report
Please find page 36 of the 2015 CarMax annual report below. You can navigate through the pages in the report by either clicking on the pages listed below, or by using the keyword search tool below to find specific information within the annual report.-
 1
1 -
2
-
3
-
4
-
5
-
6
-
7
-
8
-
9
-
10
-
11
-
12
-
13
-
14
-
15
-
16
-
17
-
18
-
19
-
20
-
21
-
22
-
23
-
24
-
25
-
 26
26 -
 27
27 -
 28
28 -
 29
29 -
 30
30 -
 31
31 -
 32
32 -
 33
33 -
 34
34 -
 35
35 -
 36
36 -
 37
37 -
 38
38 -
 39
39 -
 40
40 -
 41
41 -
 42
42 -
 43
43 -
 44
44 -
 45
45 -
 46
46 -
47
-
48
-
49
-
50
-
51
-
52
-
53
-
54
-
55
-
56
-
57
-
58
-
59
-
60
-
61
-
62
-
63
-
64
-
65
-
66
-
67
-
68
-
69
-
70
-
71
-
72
-
73
-
74
-
75
-
76
-
77
-
78
-
79
-
80
-
81
-
82
-
83
-
84
-
85
-
86
-
87
-
88
-
89
-
90
-
91
-
92
 |
 |

32
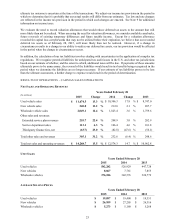
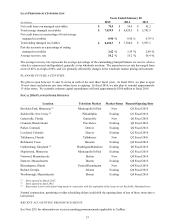
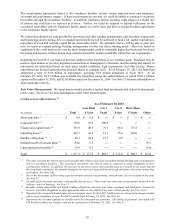
CAF ORIGINATION INFORMATION
Years Ended February 28 (1)
2015 2014 2013
N
et loans originated (in millions) $ 4,727.8 $ 4,183.9 $ 3,445.3
Vehicle units financed 243,264 218,706 179,525
Penetration rate (2) 41.2 % 40.9 %
39.4 %
Weighted average contract rate 7.1 % 7.0 %
7.9 %
Weighted average credit score (3) 701 702 696
Weighted average loan-to-value (LTV) (4) 94.2 93.7 94.8
Weighted average term (in months) 65.4 65.4 65.9
(1) All information relates to loans originated net of 3-day payoffs and vehicle returns.
(2) Vehicle units financed as a percentage of total retail units sold.
(3) The credit scores represent FICO scores, and reflect only receivables with obligors that have a FICO score at the time of
application. The FICO score with respect to any receivable with co-obligors is calculated as the average of each obligor’s
FICO score at the time of application. FICO scores are not a significant factor in our primary scoring model which relies on
information from credit bureaus and other application information as discussed in Note 4. FICO® is a federally registered
servicemark of Fair Isaac Corporation.
(4) LTV represents the ratio of the amount financed to the total collateral value, which is measured as the vehicle selling price
plus applicable taxes, title and fees.
Net loans originated in fiscal 2015 increased 13.0%, primarily reflecting the 13.3% growth in our retail vehicle
revenues. The increase in CAF’s penetration rate in fiscal 2015 included the effect of an increase in loans originated
in the CAF loan origination test.
Net loans originated in fiscal 2014 increased 21.4%, reflecting both the 17.5% growth in our retail vehicle revenues
and an increase in CAF’s penetration rate, which benefited from favorable responses to the change in our credit offers.
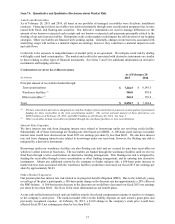
Loan Origination Test. In January 2014, CAF launched a test originating loans for customers who typically would
be financed by our Tier 3 finance providers. Through February 28, 2015, net loans originated in this test totaled
$72.2 million, of which $63.1 million were originated in fiscal 2015. Because the loans in this test have higher loss
and delinquency rates than the aggregate of the current CAF portfolio, they also have higher contract rates. The test
is being funded separately from the remainder of CAF’s portfolio and is not included in our current securitization
program. We currently plan to extend this test at a similar rate of originations while continuing to evaluate the
performance of these loans.
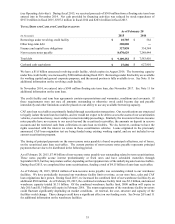
ALLOWANCE FOR LOAN LOSSES
Years Ended February 28
(In millions) 2015 % (1) 2014 % (1)
Balance as of beginning of year $69.9 0.97 $57.3
0.97
Charge-offs (155.9) (134.3)
Recoveries 85.4 74.7
Provision for loan losses 82.3 72.2
Balance as of end of year $81.7 0.97 $69.9
0.97
(1) Percent of total ending managed receivables.
The allowance for loan losses represents an estimate of the amount of net losses inherent in our portfolio of managed
receivables as of the applicable reporting date and anticipated to occur during the following 12 months. The 16.9%
increase in the dollar amount of the allowance for loan losses as of February 28, 2015 compared with a year earlier
largely reflected the growth in managed receivables. The allowance for loan losses as a percent of managed
receivables remained consistent as of February 28, 2015, and February 28, 2014.