CarMax 2015 Annual Report Download - page 44
Download and view the complete annual report
Please find page 44 of the 2015 CarMax annual report below. You can navigate through the pages in the report by either clicking on the pages listed below, or by using the keyword search tool below to find specific information within the annual report.-
 1
1 -
2
-
3
-
4
-
5
-
6
-
7
-
8
-
9
-
10
-
11
-
12
-
13
-
14
-
15
-
16
-
17
-
18
-
19
-
20
-
21
-
22
-
23
-
24
-
25
-
26
-
27
-
28
-
29
-
30
-
31
-
32
-
33
-
 34
34 -
 35
35 -
 36
36 -
 37
37 -
 38
38 -
 39
39 -
 40
40 -
 41
41 -
 42
42 -
 43
43 -
 44
44 -
 45
45 -
 46
46 -
 47
47 -
 48
48 -
 49
49 -
 50
50 -
 51
51 -
 52
52 -
 53
53 -
 54
54 -
55
-
56
-
57
-
58
-
59
-
60
-
61
-
62
-
63
-
64
-
65
-
66
-
67
-
68
-
69
-
70
-
71
-
72
-
73
-
74
-
75
-
76
-
77
-
78
-
79
-
80
-
81
-
82
-
83
-
84
-
85
-
86
-
87
-
88
-
89
-
90
-
91
-
92
 |
 |

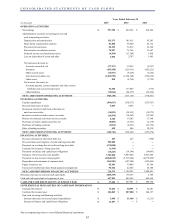
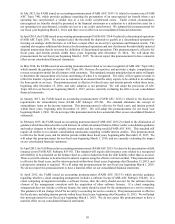
CONSOLIDATED STATEMENTS OF EARNINGS
See accompanying notes to consolidated financial statements.
40
Years Ended February 28
(In thousands except per share data) 2015 % (1) 2014 % (1) 2013 % (1)
SALES AND OPERATING REVENUES:
Used vehicle sales $ 11,674,520 81.8 $ 10,306,256 82.0 $ 8,746,965 79.8
N
ew vehicle sales 240,004 1.7 212,036 1.7 207,726 1.9
Wholesale vehicle sales 2,049,133 14.4 1,823,425 14.5 1,759,555 16.1
Other sales and revenues 305,059 2.1 232,582 1.8 248,572 2.3
NET SALES AND OPERATING REVENUES 14,268,716 100.0 12,574,299 100.0 10,962,818 100.0
Cost of sales 12,381,189 86.8 10,925,598 86.9 9,498,456 86.6
GROSS PROFIT 1,887,527 13.2 1,648,701 13.1 1,464,362 13.4
CARMAX AUTO FINANCE INCOME 367,294 2.6 336,167 2.7 299,267 2.7
Selling, general and administrative expenses 1,257,725 8.8 1,155,215 9.2 1,031,034 9.4
Interest expense 24,473 0.2 30,834 0.2 32,357 0.3
Other (expense) income (3,292) ― (1,497) ― 1,113 ―
Earnings before income taxes 969,331 6.8 797,322 6.3 701,351 6.4
Income tax provision 371,973 2.6 304,736 2.4 267,067 2.4
NET EARNINGS $ 597,358 4.2 $ 492,586 3.9 $ 434,284 4.0
WEIGHTED AVERAGE COMMON SHARES:
Basic 215,617 223,589 228,095
Diluted 218,691 227,584 231,823
NET EARNINGS PER SHARE:
Basic $ 2.77 $ 2.20 $ 1.90
Diluted $ 2.73 $ 2.16 $ 1.87
(1) Percents are calculated as a percentage of net sales and operating revenues and may not equal totals due to rounding.