CarMax 2015 Annual Report Download - page 60
Download and view the complete annual report
Please find page 60 of the 2015 CarMax annual report below. You can navigate through the pages in the report by either clicking on the pages listed below, or by using the keyword search tool below to find specific information within the annual report.-
 1
1 -
2
-
3
-
4
-
5
-
6
-
7
-
8
-
9
-
10
-
11
-
12
-
13
-
14
-
15
-
16
-
17
-
18
-
19
-
20
-
21
-
22
-
23
-
24
-
25
-
26
-
27
-
28
-
29
-
30
-
31
-
32
-
33
-
34
-
35
-
36
-
37
-
38
-
39
-
40
-
41
-
42
-
43
-
44
-
45
-
46
-
47
-
48
-
49
-
 50
50 -
 51
51 -
 52
52 -
 53
53 -
 54
54 -
 55
55 -
 56
56 -
 57
57 -
 58
58 -
 59
59 -
 60
60 -
 61
61 -
 62
62 -
 63
63 -
 64
64 -
 65
65 -
 66
66 -
 67
67 -
 68
68 -
 69
69 -
 70
70 -
71
-
72
-
73
-
74
-
75
-
76
-
77
-
78
-
79
-
80
-
81
-
82
-
83
-
84
-
85
-
86
-
87
-
88
-
89
-
90
-
91
-
92
 |
 |

56
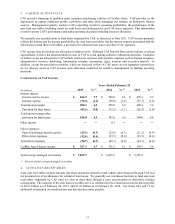
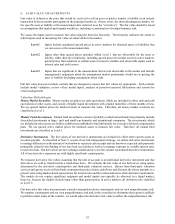
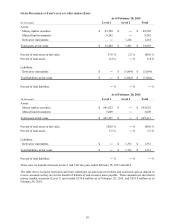
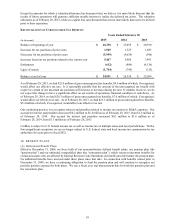
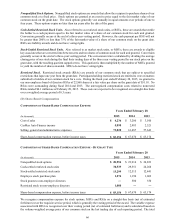
ITEMS MEASURED AT FAIR VALUE ON A RECURRING BASIS
As of February 28, 2015
(In thousands) Level 1 Level 2 Total
Assets:
Money market securities $ 43,250 $ ― $ 43,250
Mutual fund investments 9,242 ― 9,242
Derivative instruments ― 1,201 1,201
Total assets at fair value $ 52,492 $ 1,201 $ 53,693
Percent of total assets at fair value 97.8 % 2.2 % 100.0 %
Percent of total assets 0.4 % ― % 0.4 %
Liabilities:
Derivative instruments $ ― $ (1,064) $ (1,064)
Total liabilities at fair value $ ― $ (1,064) $ (1,064)
Percent of total liabilities ―% ― % ―%
As of February 28, 2014
(In thousands) Level 1 Level 2 Total
Assets:
Money market securities $ 641,622 $ ― $ 641,622
Mutual fund investments 5,609 ― 5,609
Total assets at fair value $ 647,231 $ ― $ 647,231
Percent of total assets at fair value 100.0 % ― % 100.0 %
Percent of total assets 5.5 % ― % 5.5 %
Liabilities:
Derivative instruments $ ― $ 1,351 $ 1,351
Total liabilities at fair value $ ― $ 1,351 $ 1,351
Percent of total liabilities ―% ― % ―%
There were no transfers between Levels 1 and 2 for the years ended February 28, 2015 and 2014.
The table above excludes restricted cash from collections on auto loan receivables and restricted cash on deposit in
reserve accounts as they are for the benefit of holders of non-recourse notes payable. These amounts are invested in
money market securities (Level 1) and totaled $336.8 million as of February 28, 2015, and $291.8 million as of
February 28, 2014.