CarMax 2015 Annual Report Download - page 71
Download and view the complete annual report
Please find page 71 of the 2015 CarMax annual report below. You can navigate through the pages in the report by either clicking on the pages listed below, or by using the keyword search tool below to find specific information within the annual report.-
 1
1 -
2
-
3
-
4
-
5
-
6
-
7
-
8
-
9
-
10
-
11
-
12
-
13
-
14
-
15
-
16
-
17
-
18
-
19
-
20
-
21
-
22
-
23
-
24
-
25
-
26
-
27
-
28
-
29
-
30
-
31
-
32
-
33
-
34
-
35
-
36
-
37
-
38
-
39
-
40
-
41
-
42
-
43
-
44
-
45
-
46
-
47
-
48
-
49
-
50
-
51
-
52
-
53
-
54
-
55
-
56
-
57
-
58
-
59
-
60
-
 61
61 -
 62
62 -
 63
63 -
 64
64 -
 65
65 -
 66
66 -
 67
67 -
 68
68 -
 69
69 -
 70
70 -
 71
71 -
 72
72 -
 73
73 -
 74
74 -
 75
75 -
 76
76 -
 77
77 -
 78
78 -
 79
79 -
 80
80 -
 81
81 -
82
-
83
-
84
-
85
-
86
-
87
-
88
-
89
-
90
-
91
-
92
 |
 |

67
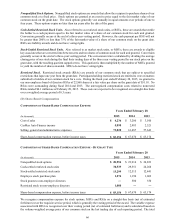
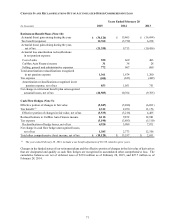
costs for matching contributions for our employee stock purchase plan are included in share-based compensation
expense. There were no capitalized share-based compensation costs as of or for the years ended February 28, 2015,
2014 or 2013.
STOCK OPTION ACTIVITY
Weighted
Average
Weighted Remaining Aggregate
Number of Average Contractual Intrinsic
(Shares and intrinsic value in thousands) Shares Exercise Price Life (Years) Value
Outstanding as of February 28, 2014 10,018 $ 27.02
Options granted 2,057 45.08
Options exercised (4,390) 20.46
Options forfeited or expired (40) 37.44
Outstanding as of February 28, 2015 7,645 $ 35.59 4.3 $ 240,941
Exercisable as of February 28, 2015 3,597 $ 29.86 3.3 $ 133,975
We granted nonqualified options to purchase 2,056,789 shares of common stock in fiscal 2015, 1,605,149 shares in
fiscal 2014 and 2,252,124 shares in fiscal 2013. The total cash received as a result of stock option exercises was
$89.8 million in fiscal 2015, $45.1 million in fiscal 2014 and $71.7 million in fiscal 2013. We settle stock option
exercises with authorized but unissued shares of our common stock. The total intrinsic value of options exercised was
$153.3 million for fiscal 2015, $62.5 million for fiscal 2014 and $68.0 million for fiscal 2013. We realized related
tax benefits of $61.7 million in fiscal 2015, $25.1 million for fiscal 2014 and $27.2 million for fiscal 2013.
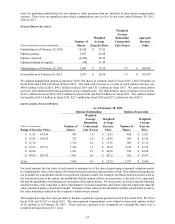
OUTSTANDING STOCK OPTIONS
As of February 28, 2015
Options Outstanding Options Exercisable
Weighted
Average Weighted Weighted
Remaining Average Average
(Shares in thousands) Number of Contractual Exercise Number of Exercise
Range of Exercise Prices Shares Life (Years) Price Shares Price
$ 11.43 - $14.49 458 1.0 $ 12.03 458 $ 12.03
$ 19.82 - $30.24 723 2.4 $ 25.46 699 $ 25.30
$ 31.76 1,732 4.1 $ 31.76 903 $ 31.76
$ 32.05 - $33.11 1,356 3.1 $ 32.70 1,036 $ 32.70
$ 42.68 1,411 5.1 $ 42.68 399 $ 42.68
$ 44.96 - $67.82 1,965 6.1 $ 45.12 102 $ 45.47
Total 7,645 4.3 $ 35.59 3,597 $ 29.86
For stock options, the fair value of each award is estimated as of the date of grant using a binomial valuation model.
In computing the value of the option, the binomial model considers characteristics of fair-value option pricing that are
not available for consideration under a closed-form valuation model (for example, the Black-Scholes model), such as
the contractual term of the option, the probability that the option will be exercised prior to the end of its contractual
life and the probability of termination or retirement of the option holder. For this reason, we believe that the binomial
model provides a fair value that is more representative of actual experience and future expected experience than the
value calculated using a closed-form model. Estimates of fair value are not intended to predict actual future events or
the value ultimately realized by the recipients of share-based awards.
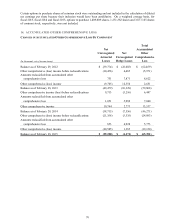
The weighted average fair value per share at the date of grant for options granted was $13.28 in fiscal 2015, $15.59 in
fiscal 2014 and $12.67 in fiscal 2013. The unrecognized compensation costs related to nonvested options totaled
$31.6 million as of February 28, 2015. These costs are expected to be recognized on a straight-line basis over a
weighted average period of 2.1 years.