CarMax 2015 Annual Report Download - page 33
Download and view the complete annual report
Please find page 33 of the 2015 CarMax annual report below. You can navigate through the pages in the report by either clicking on the pages listed below, or by using the keyword search tool below to find specific information within the annual report.-
 1
1 -
2
-
3
-
4
-
5
-
6
-
7
-
8
-
9
-
10
-
11
-
12
-
13
-
14
-
15
-
16
-
17
-
18
-
19
-
20
-
21
-
22
-
 23
23 -
 24
24 -
 25
25 -
 26
26 -
 27
27 -
 28
28 -
 29
29 -
 30
30 -
 31
31 -
 32
32 -
 33
33 -
 34
34 -
 35
35 -
 36
36 -
 37
37 -
 38
38 -
 39
39 -
 40
40 -
 41
41 -
 42
42 -
 43
43 -
44
-
45
-
46
-
47
-
48
-
49
-
50
-
51
-
52
-
53
-
54
-
55
-
56
-
57
-
58
-
59
-
60
-
61
-
62
-
63
-
64
-
65
-
66
-
67
-
68
-
69
-
70
-
71
-
72
-
73
-
74
-
75
-
76
-
77
-
78
-
79
-
80
-
81
-
82
-
83
-
84
-
85
-
86
-
87
-
88
-
89
-
90
-
91
-
92
 |
 |

29
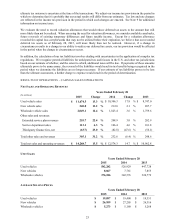
Other Gross Profit
Other gross profit includes profits related to EPP revenues, net third-party finance fees and service department
operations, including used vehicle reconditioning. We have no cost of sales related to EPP revenues or net third-party
finance fees, as these represent commissions paid to us by certain third-party providers. Third-party finance fees are
reported net of the fees we pay to third-party Tier 3 finance providers. Accordingly, changes in the relative mix of
the other gross profit components can affect the composition and amount of other gross profit.
The fiscal 2014 correction in accounting for EPP cancellation reserves reduced fiscal 2014 other gross profit by
$19.5 million related to activity for fiscal 2013 and fiscal 2012.
Fiscal 2015 Versus Fiscal 2014. Excluding the prior year’s EPP cancellation reserve correction, other gross profit
increased 20.5% in fiscal 2015, consistent with the changes in other sales and revenues discussed above.
Fiscal 2014 Versus Fiscal 2013. Excluding the EPP cancellation reserve correction, other gross profit increased
14.6% in fiscal 2014. This change reflected the net effects of the 12.6% increase in EPP revenues excluding the
cancellation reserve correction, the $26.7 million decrease in net third-party finance fees and higher service department
gross profits. The $27.3 million increase in fiscal 2014 service department gross profit primarily reflected increases
in gross profit associated with used vehicle reconditioning, which benefited from strong used unit sales growth and
the resulting leverage of service overhead costs.
Impact of Inflation
Historically, inflation has not had a significant impact on results. Profitability is primarily affected by our ability to
achieve targeted unit sales and gross profit dollars per vehicle rather than by changes in average retail prices. However,
increases in average vehicle selling prices benefit CAF income, to the extent the average amount financed also
increases.
In the years following the recession, we experienced a period of appreciation in used vehicle wholesale pricing. We
believe the appreciation resulted, in part, from a reduced supply of late-model used vehicles in the market. This
reduced supply was caused by the dramatic decline in new car industry sales and the associated slow down in used
vehicle trade-in activity, compared with pre-recession periods. The higher wholesale values increased both our vehicle
acquisition costs and our used vehicle average selling prices, which climbed from $16,291 in fiscal 2009 to $19,897
in fiscal 2015.
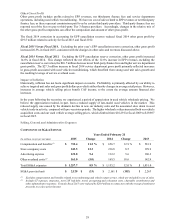
Selling, General and Administrative Expenses
COMPONENTS OF SG&A EXPENSE
Years Ended February 28
(In millions except per unit data) 2015 Change 2014 Change 2013
Compensation and benefits (1)
$730.4 11.2% $ 656.7 12.9 % $ 581.9
Store occupancy costs 243.5 12.3 216.8 8.5 199.9
Advertising expense 122.8 9.4 112.2 5.6 106.3
Other overhead costs (2)
161.0 (5.0) 169.5 18.6 142.9
Total SG&A expenses $ 1,257.7 8.9 % $ 1,155.2 12.0 % $ 1,031.0
SG&A per retail unit $ 2,128 $ (33) $ 2,161$ (102) $ 2,263
(1) Excludes compensation and benefits related to reconditioning and vehicle repair service, which are included in cost of sales.
(2) Includes IT expenses, insurance, non-CAF bad debt, travel, preopening and relocation costs, charitable contributions and
other administrative expenses. Costs for fiscal 2015 were reduced by $20.9 million in connection with the receipt of settlement
proceeds in a class action lawsuit.