CarMax 2015 Annual Report Download - page 31
Download and view the complete annual report
Please find page 31 of the 2015 CarMax annual report below. You can navigate through the pages in the report by either clicking on the pages listed below, or by using the keyword search tool below to find specific information within the annual report.-
 1
1 -
2
-
3
-
4
-
5
-
6
-
7
-
8
-
9
-
10
-
11
-
12
-
13
-
14
-
15
-
16
-
17
-
18
-
19
-
20
-
 21
21 -
 22
22 -
 23
23 -
 24
24 -
 25
25 -
 26
26 -
 27
27 -
 28
28 -
 29
29 -
 30
30 -
 31
31 -
 32
32 -
 33
33 -
 34
34 -
 35
35 -
 36
36 -
 37
37 -
 38
38 -
 39
39 -
 40
40 -
 41
41 -
42
-
43
-
44
-
45
-
46
-
47
-
48
-
49
-
50
-
51
-
52
-
53
-
54
-
55
-
56
-
57
-
58
-
59
-
60
-
61
-
62
-
63
-
64
-
65
-
66
-
67
-
68
-
69
-
70
-
71
-
72
-
73
-
74
-
75
-
76
-
77
-
78
-
79
-
80
-
81
-
82
-
83
-
84
-
85
-
86
-
87
-
88
-
89
-
90
-
91
-
92
 |
 |
27
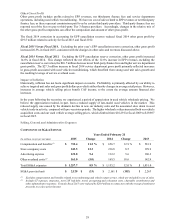
Fiscal 2014 Versus Fiscal 2013. The 17.8% increase in used vehicle revenues in fiscal 2014 resulted from a corresponding
increase in used unit sales. The increase in unit sales included a 12.2% increase in comparable store used unit sales and
sales from newer stores not yet included in the comparable store base. The comparable store used unit growth was primarily
driven by improved conversion, as well as a modest increase in store traffic. We believe the strong conversion reflected
continued improvements in execution in our stores and an attractive credit environment experienced during fiscal 2014. Our
data indicates that in our markets, we increased our share of the 0- to 10-year old used vehicle market by approximately
16% in fiscal 2014.
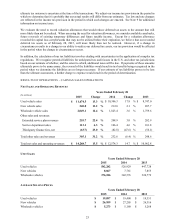
Wholesale Vehicle Sales
Our wholesale auction prices usually reflect the trends in the general wholesale market for the types of vehicles we
sell, although they can also be affected by changes in vehicle mix or the average age, mileage or condition of the
vehicles bought through our appraisal process and sold in our auctions.
Fiscal 2015 Versus Fiscal 2014. The 12.4% increase in wholesale vehicle revenues in fiscal 2015 resulted from a
9.8% increase in wholesale unit sales and a 2.2% increase in average wholesale vehicle selling price. The wholesale
unit growth reflected both an increase in the appraisal buy rate and the growth in our store base.
Fiscal 2014 Versus Fiscal 2013. The 3.6% increase in wholesale vehicle revenues in fiscal 2014 resulted from a
5.5% increase in wholesale unit sales, partially offset by a 2.1% reduction in average wholesale vehicle selling price.
The wholesale unit growth primarily reflected the growth in our store base, as well as an increase in the appraisal buy
rate. However, we experienced a reduced mix of wholesale vehicles in our appraisal traffic that partially offset the
benefit of our store growth and increased buy rate.
Other Sales and Revenues
Other sales and revenues include commissions on the sale of ESPs and GAP (collectively reported in EPP revenues,
net of a reserve for estimated contract cancellations), service department sales and net third-party finance fees. The
fixed, per-vehicle fees that we pay to the Tier 3 providers are reflected as an offset to finance fee revenues received
from the Tier 2 providers.
During fiscal 2014, we corrected our accounting related to cancellation reserves for ESP and GAP, with resulting
increases in reserves related to activity for fiscal 2014, fiscal 2013 and fiscal 2012. The portion related to fiscal 2013
and fiscal 2012 was $19.5 million, or $0.05 per share. In the following discussions, where indicated, year-over-year
comparisons exclude the portion of the correction that related to earlier fiscal years.
Fiscal 2015 Versus Fiscal 2014. Excluding the prior year’s EPP cancellation reserve correction, other sales and
revenues grew 21.0% in fiscal 2015. EPP revenue grew 11.9% excluding the prior year’s cancellation reserve
correction, largely reflecting the increase in our retail unit sales. Net third-party finance fees improved 23.0%
primarily due to a mix shift among providers, including an increase in the percentage of our retail unit sales financed
by the Tier 2 providers and a reduction in the percentage financed by the Tier 3 providers. The percentage of retail
vehicles financed by Tier 3 providers, combined with those financed under the previously announced CAF loan
origination test, was 15.6% in fiscal 2015 compared with 18.8% in fiscal 2014.
Fiscal 2014 Versus Fiscal 2013. Excluding the EPP cancellation reserve correction, other sales and revenues
increased 1.4% in fiscal 2014. EPP revenue grew 12.6% excluding the cancellation reserve correction, reflecting the
increase in our retail unit sales and a higher EPP penetration rate, partially offset by higher estimated cancellation
reserve rates. The $26.7 million decrease in net third-party finance fees was driven by a mix shift among providers,
including an increase in the percentage of our retail unit sales financed by Tier 3 providers to 18.8% in fiscal 2014
versus 15.9% in fiscal 2013. Throughout fiscal 2013 and for most of fiscal 2014, the volume and share of financing
originated by the Tier 3 providers increased on a year-over-year basis, as these providers made more attractive offers
to customers. In the fourth quarter of fiscal 2014, however, the Tier 3 providers moderated their credit offerings, and
as a result, their share of financings for the fourth quarter was flat with fiscal 2013.